Fig. 7
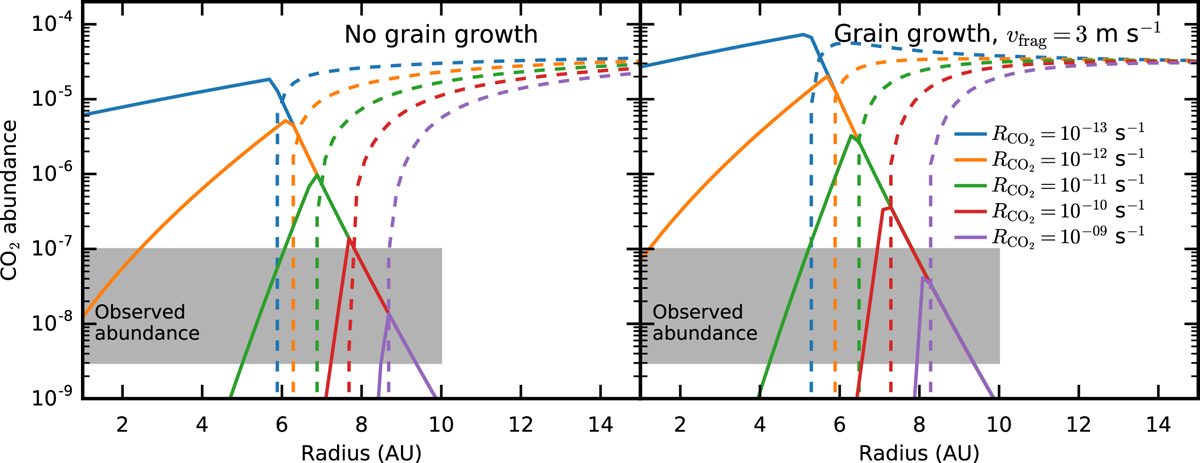
Abundance of CO2 as function of radii for models with different destruction rates of CO2. These modeluse α = 10−3 and uf = 0 m s−1 (left) and uf = 3 m s−1 (right). Abundance profiles after 1 Myr of evolution are shown. At this point the disk has reached a semi steady state. A destruction rate of at least 10−11 s−1 is needed to keep the averaged CO2 abundance below the observational limit. The iceline is further out for models with higher destruction rates as the destruction of gas-phase CO2 lowers the total abundance of CO2 within 10 AU where CO2 can sublimate.
Current usage metrics show cumulative count of Article Views (full-text article views including HTML views, PDF and ePub downloads, according to the available data) and Abstracts Views on Vision4Press platform.
Data correspond to usage on the plateform after 2015. The current usage metrics is available 48-96 hours after online publication and is updated daily on week days.
Initial download of the metrics may take a while.