Fig. 3
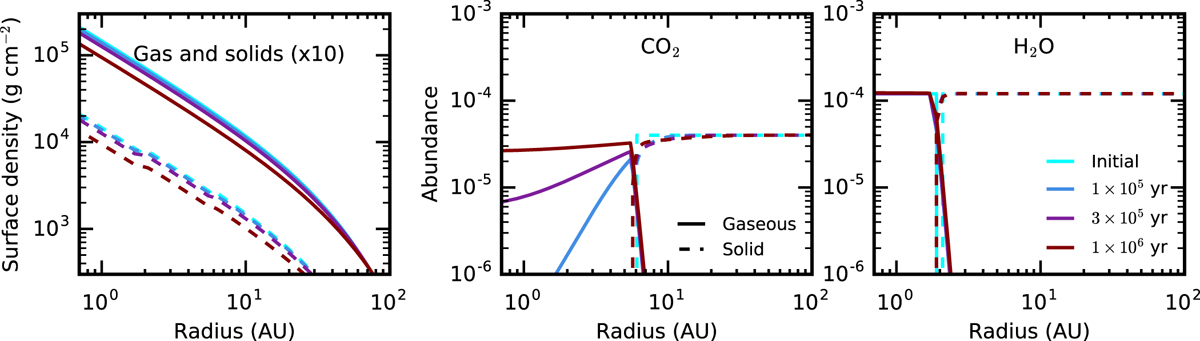
Time evolution series for a model without grain growth. This model assumes an α of 10−3 . Left: surface density of the gas (solid lines) and solids (dashed lines), the solid surface density is the sum of the dust and ice surface densities, it has been multiplied by a factor of 10 for visualization. Middle: abundance of CO2 . Right: abundance of H2O.
Current usage metrics show cumulative count of Article Views (full-text article views including HTML views, PDF and ePub downloads, according to the available data) and Abstracts Views on Vision4Press platform.
Data correspond to usage on the plateform after 2015. The current usage metrics is available 48-96 hours after online publication and is updated daily on week days.
Initial download of the metrics may take a while.