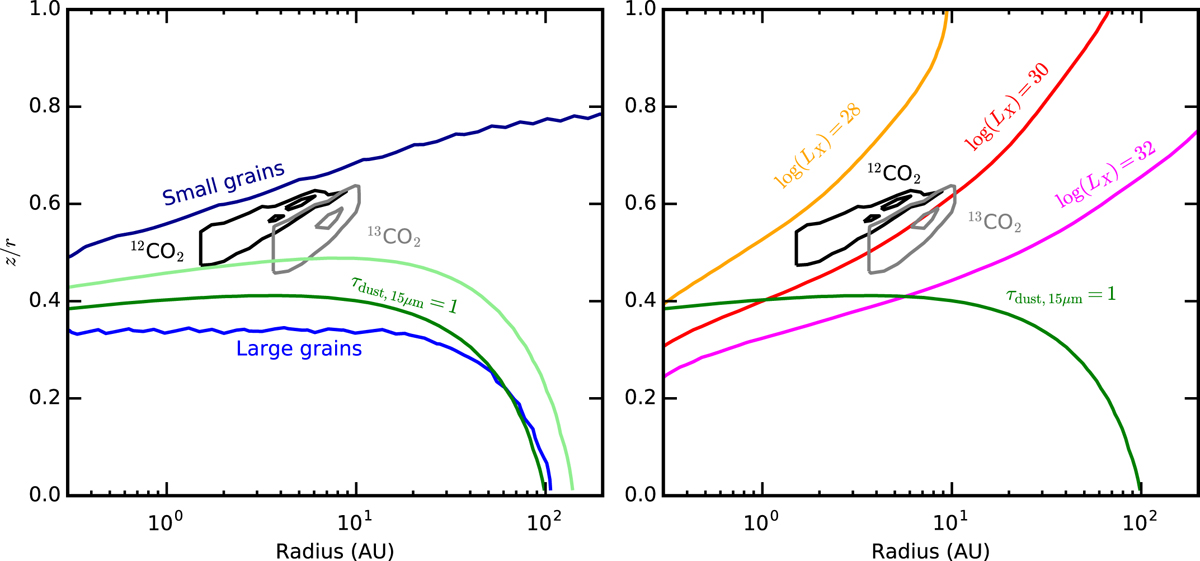
Fig. 13

Left: depth into the disk to which UV can destroy CO2 at a rate of 10−11 s−1 for a disk with an upper disk gas-to-dust ratio of 1000 and large grains (cyan) and small grains (blue). The black and grey contours show the area from which 25% and 75% of the emission of 12 CO 2 and 13 CO2 respectively originates. The green lines show the dust τ = 1 surface at 15 μm for the large grains (up to 1 mm, dark green) and small grains (up to 1 μm, light green) respectively. The UV photo destruction rate has a stronger dependence on the grain size distribution than this μm dust photosphere. Right: depth into the disk to which X-rays can destroy CO2 at a rate of 10−11 s−1 for different stellar X-ray luminosities (LX in erg s−1 ). The black and grey contours show the area from which 25% and 75% of the emission of 12 CO 2 and 13 CO2 respectively is coming from. The green line shows the dust τ = 1 surface at 15 μm for the large grains (up to 1 mm).
Current usage metrics show cumulative count of Article Views (full-text article views including HTML views, PDF and ePub downloads, according to the available data) and Abstracts Views on Vision4Press platform.
Data correspond to usage on the plateform after 2015. The current usage metrics is available 48-96 hours after online publication and is updated daily on week days.
Initial download of the metrics may take a while.


