Fig. 12
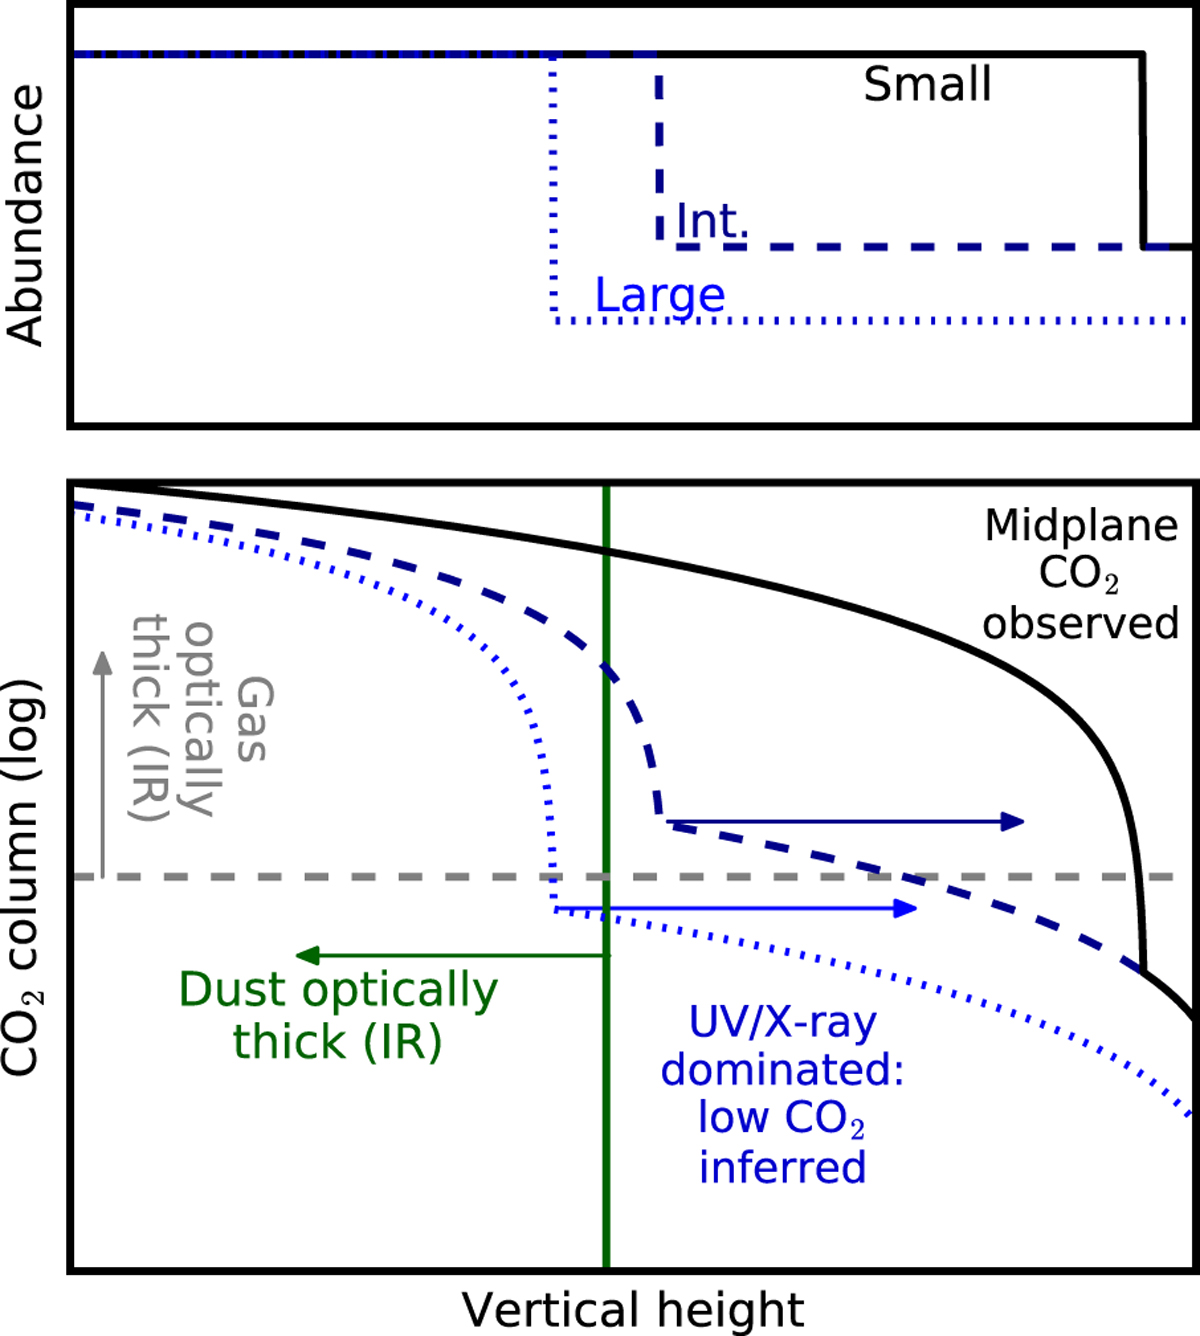
Schematic of the vertical CO2 abundance (top panel) and upwards column (bottom panel) as function of disk height. Three different cases areshown in solid black, dashed dark blue and dotted blue lines. The black line shows the case for shallow UV or X-ray penetration, in this case an abundance similar to the midplane CO2 abundance will be measured. The dashed dark blue line shows a slightly deeper penetration of radiation, in which case a lower CO2 abundance will be inferred from the observations because the gas is optically thick and hiding the higher abundance deeper into the disk. The dotted blue line shows the case of deep penetration. In this case a low CO2 abundance will be inferred due to the dust hiding the bulk of the CO2. The vertical lines in the upper panel show where the disk becomes optically thick to CO2 lines, the solid and dashed grey line, show where the gas becomes optically thick for the small and intermediate PDR or XDR respectively, the green dotted line shows where the dust becomes optically thick, which is above where the gas becomes optically thick for the large PDR or XDR.
Current usage metrics show cumulative count of Article Views (full-text article views including HTML views, PDF and ePub downloads, according to the available data) and Abstracts Views on Vision4Press platform.
Data correspond to usage on the plateform after 2015. The current usage metrics is available 48-96 hours after online publication and is updated daily on week days.
Initial download of the metrics may take a while.