Fig. 11
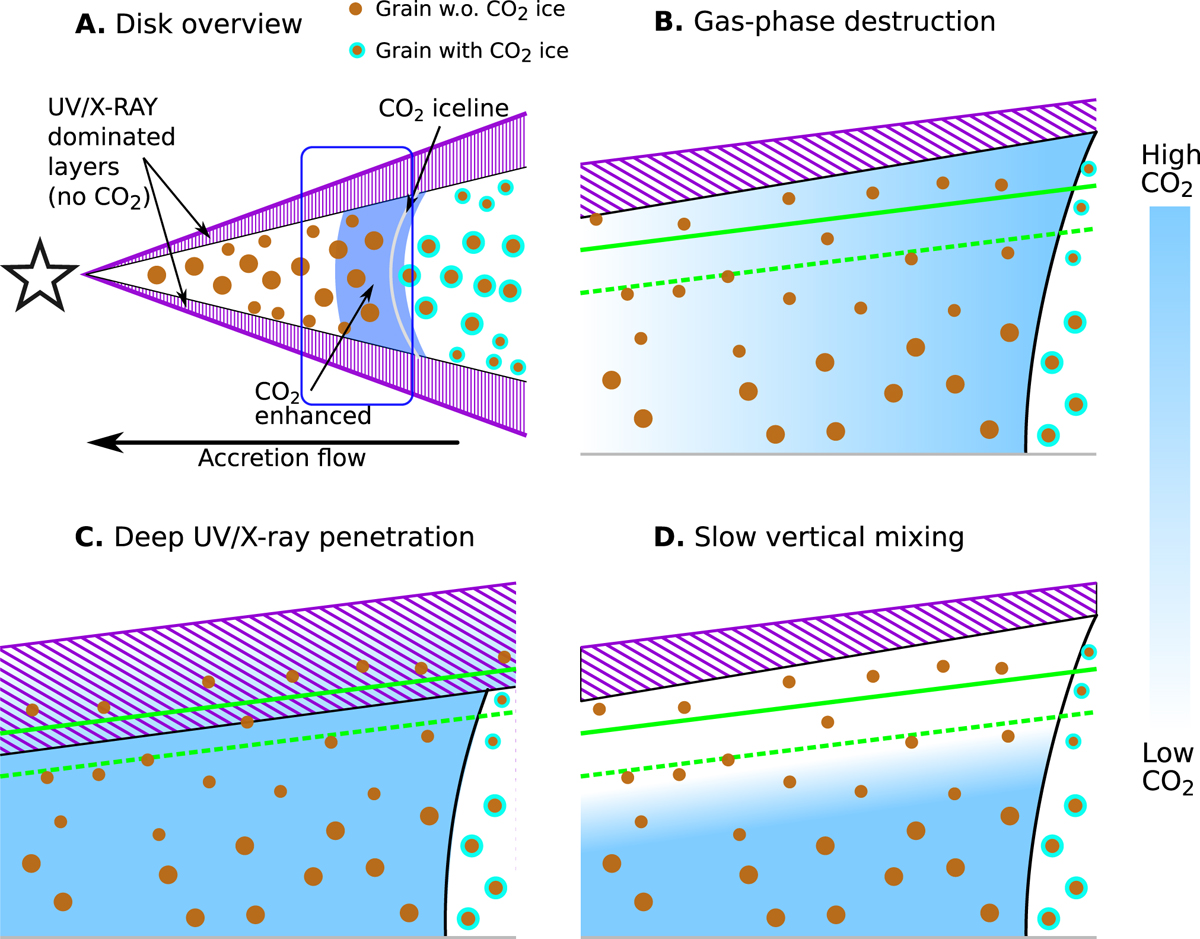
Schematic representation of the CO2 abundance near the iceline in the r–z plane. Panels B, C and D approximately represent the top half of the blue box in panel A. The straight green lines denote the τ = 1 surface for 12CO2 (solid) and 13CO2 (dashed). Panels B, C and D: the abundance structure under different mechanism to explain the difference in CO2 abundance between the predictions of the viscous model and the IR observations. Panel B: the case for a constant gas-phase destruction rate due to some as yet unidentified process (Sect. 4.4). Panel C: the abundance structure for deep UV/X-ray penetration (Sects. 5.2.5 and 5.2.6). In more extreme cases, the 13 CO 2 τ = 1 surface can also be in the UV/X-ray dominated region. Panel D: the abundance structure for negligible vertical mixing (Sect. 5.2.1). Image not to scale.
Current usage metrics show cumulative count of Article Views (full-text article views including HTML views, PDF and ePub downloads, according to the available data) and Abstracts Views on Vision4Press platform.
Data correspond to usage on the plateform after 2015. The current usage metrics is available 48-96 hours after online publication and is updated daily on week days.
Initial download of the metrics may take a while.