Fig. 5
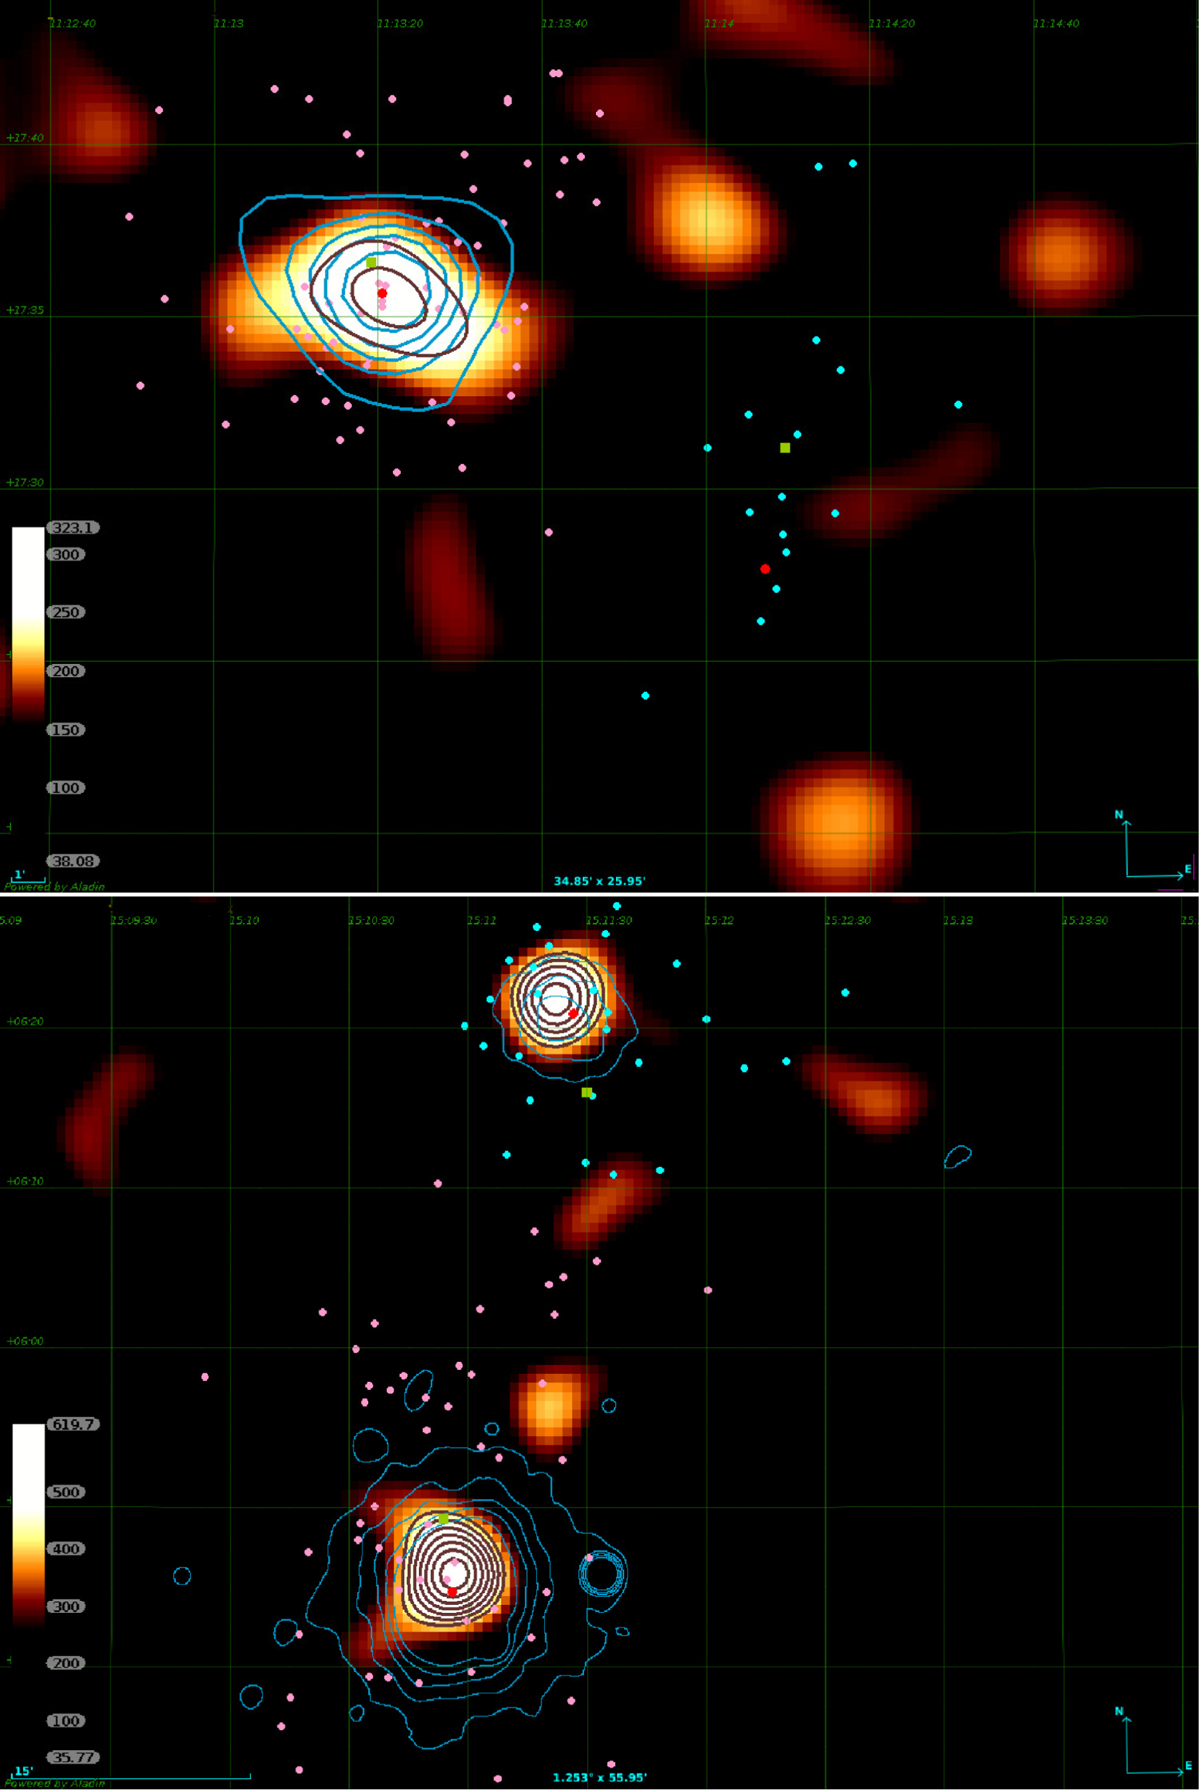
Projected density distribution in the field A1204 (upper panel) and in the field of A2029 and A2033 (lower panel) obtained with the weak lensing analysis. The scale, marked at bottom left, is given in h70 M⊙ pc−2. Red contours corresponds to a projected density above 3σ significance level (250 h70 M⊙ pc−2 for A1204 and 400 h70 M⊙ pc−2 for A2029/A2033) with steps of 50 M⊙ pc−2. X-ray contours are plotted in blue, the contour levels are (3, 5, 7, 9 and 12) times the rms noise. Red dots and green squares are the BCGs positions and the dynamical centres, respectively. Pink and light-blue points are the positions of the galaxies classified as members, for the primary and secondary component of A1204 and for A2029 and A2033, respectively.
Current usage metrics show cumulative count of Article Views (full-text article views including HTML views, PDF and ePub downloads, according to the available data) and Abstracts Views on Vision4Press platform.
Data correspond to usage on the plateform after 2015. The current usage metrics is available 48-96 hours after online publication and is updated daily on week days.
Initial download of the metrics may take a while.