Fig. 2
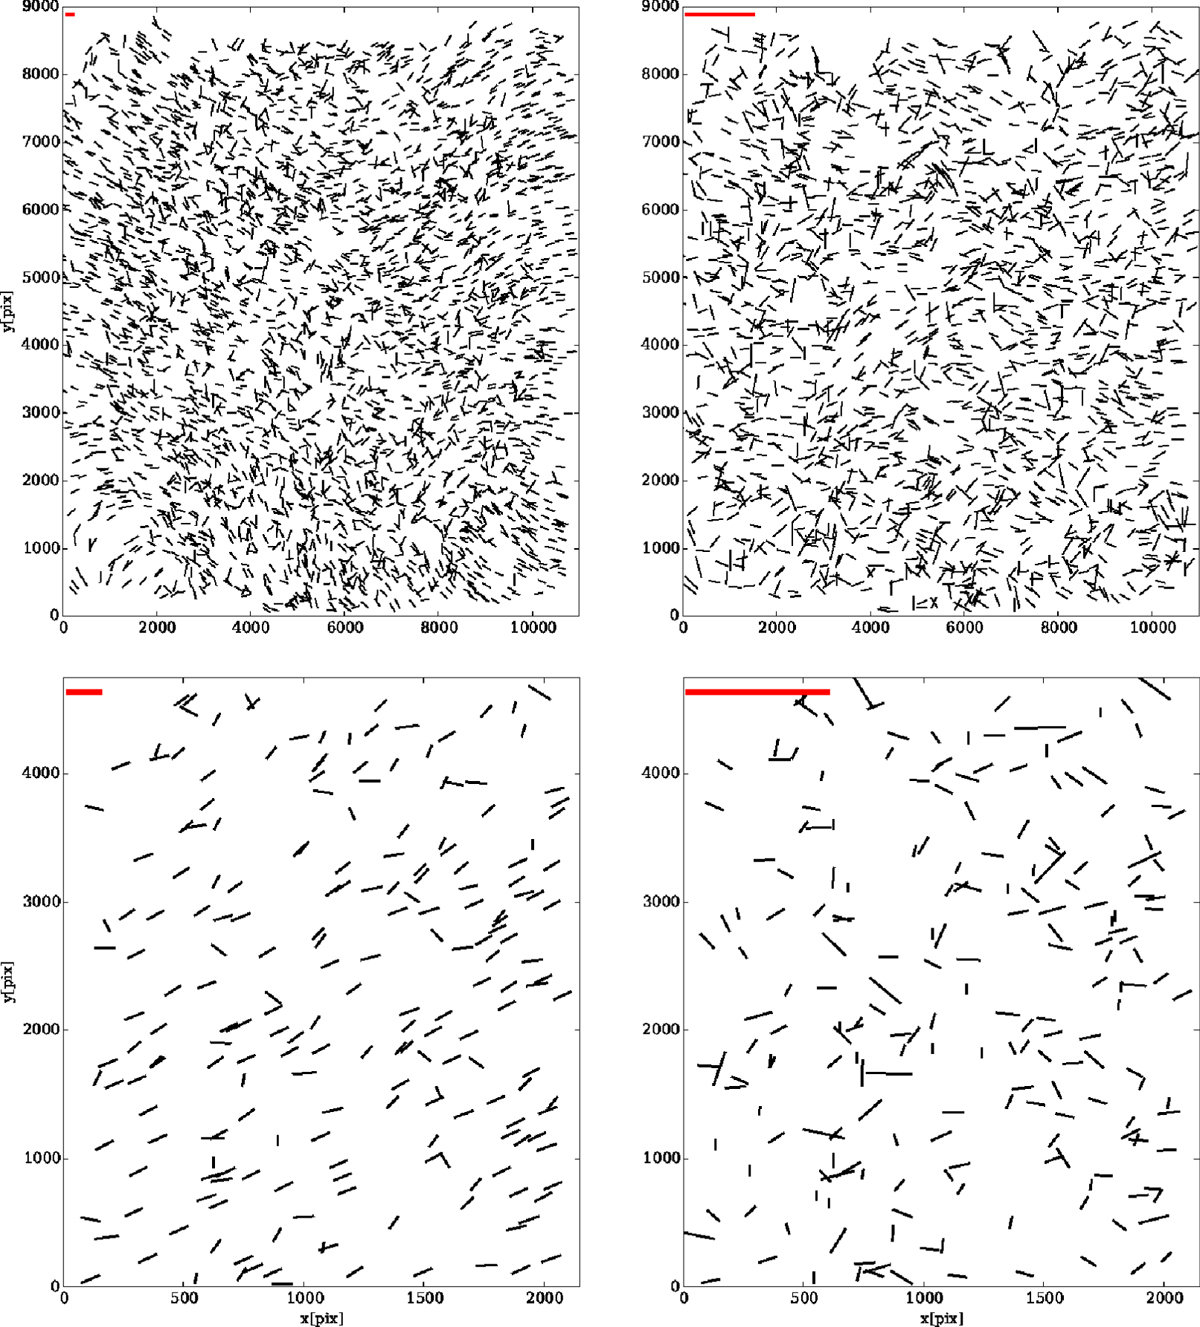
PSF treatment applied to stars in the Subaru frame (upper panel) and in one of the frames of the CFHT mosaic (lower panel). Semi-major axis distribution in the CCD, of the sources classified as stars, before (left) and after (right) the PSF deconvolution. For a better visualization of the plot, semi-major axes have a different scale than the CCD axes. Semi-major axis scale is given by the red thicker segment in the upper left-hand corner and corresponds to 3 pixels. We highlight that the semi-major axis is more randomly distributed and is significantly smaller after taking into account the PSF.
Current usage metrics show cumulative count of Article Views (full-text article views including HTML views, PDF and ePub downloads, according to the available data) and Abstracts Views on Vision4Press platform.
Data correspond to usage on the plateform after 2015. The current usage metrics is available 48-96 hours after online publication and is updated daily on week days.
Initial download of the metrics may take a while.