Fig. 1
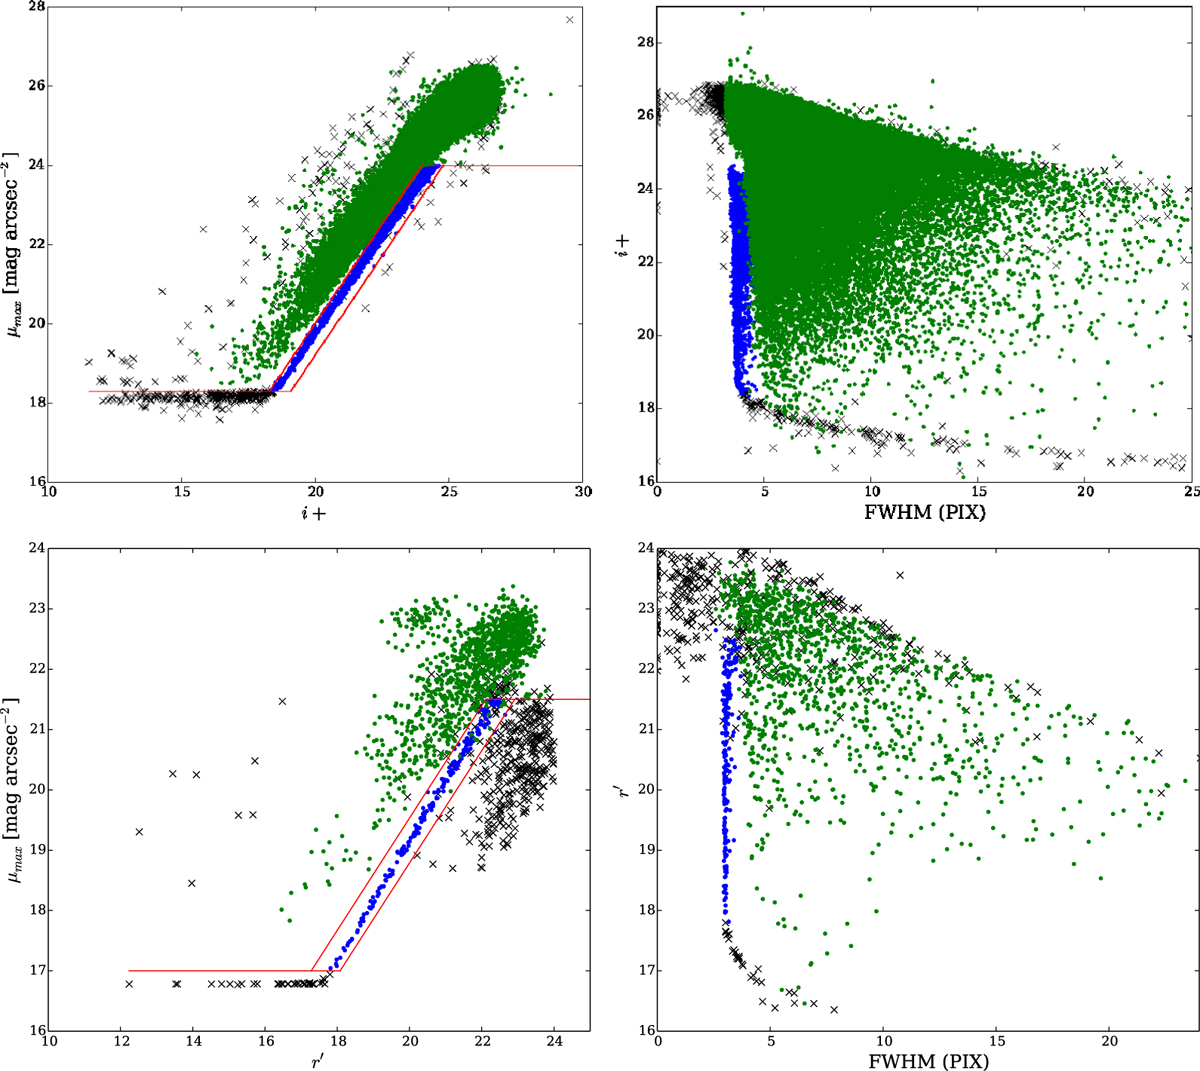
Classification of the detected sources in the Subaru frame (upper panel) and in one of the frames of the CFHT mosaic (lower panel). Here stars are represented with blue points, galaxies by green points and false detections by black crosses. Left panels show the central surface brightness of the objects (μMAX ) as a function of the magnitude. Stars are confined in the region marked by the red lines. Right panels show the source distribution in the diagram FWHM as a function of the magnitude. As it can be seen, the FWHM of the sources classified as stars remains roughly invariant for the total range in magnitude.
Current usage metrics show cumulative count of Article Views (full-text article views including HTML views, PDF and ePub downloads, according to the available data) and Abstracts Views on Vision4Press platform.
Data correspond to usage on the plateform after 2015. The current usage metrics is available 48-96 hours after online publication and is updated daily on week days.
Initial download of the metrics may take a while.