Free Access
Fig. 18
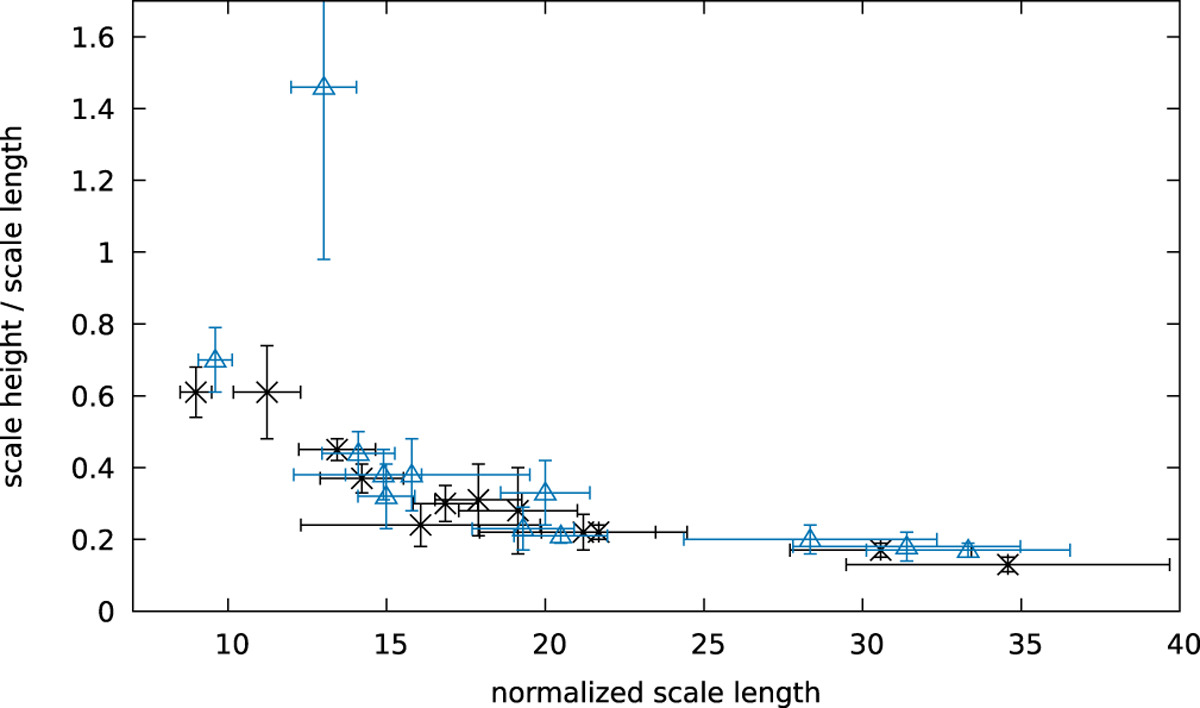
Scaleheights in units of scale lengths vs. scale length divided by the radio diameter (i.e. normalized scale length). C-band data are represented by black asterisks, L-band data by blue triangles. The outlier is again NGC 3003 in L-band. This plot is free of diameter dependence.
Current usage metrics show cumulative count of Article Views (full-text article views including HTML views, PDF and ePub downloads, according to the available data) and Abstracts Views on Vision4Press platform.
Data correspond to usage on the plateform after 2015. The current usage metrics is available 48-96 hours after online publication and is updated daily on week days.
Initial download of the metrics may take a while.