Fig. 12
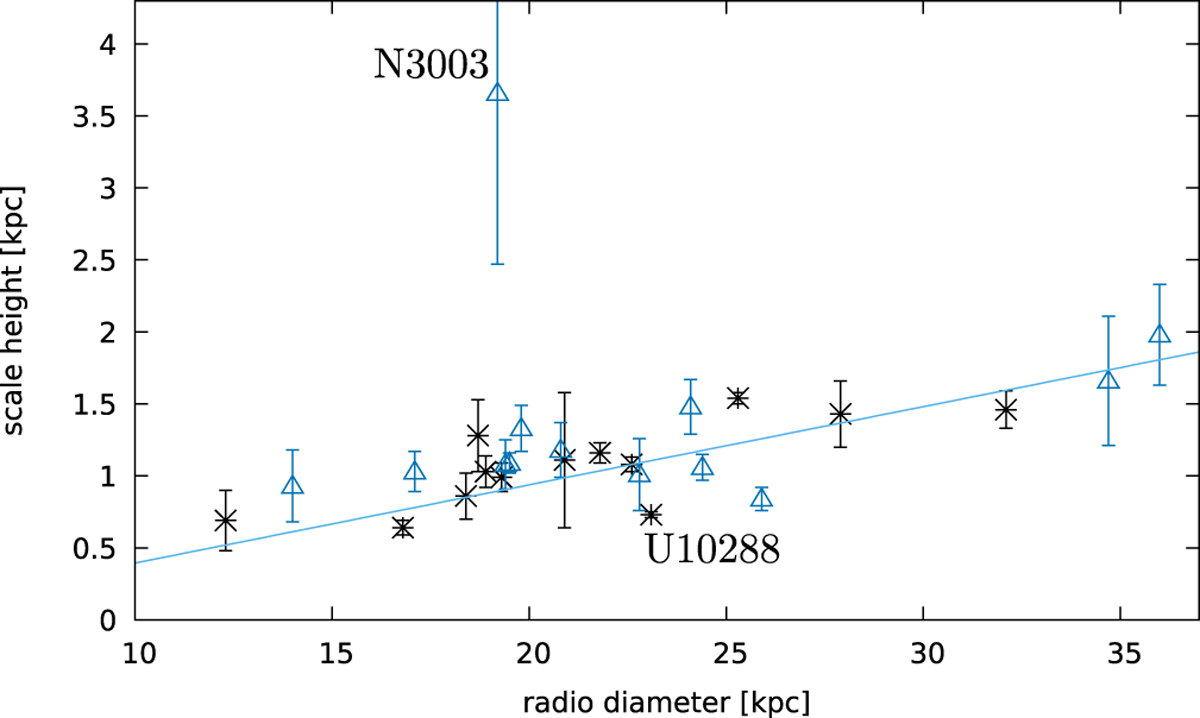
Halo scale height vs. the radio diameter. C-band data are represented by black asterisks, L-band data by blue triangles. A weighted linear fit to all data together has a slope of 0.05 ± 0.01 with intercept of about zero ( − 0.15 ± 0.29). For clarity, only the errors in scale height are presented; those in diameter are identical with Fig. 13.
Current usage metrics show cumulative count of Article Views (full-text article views including HTML views, PDF and ePub downloads, according to the available data) and Abstracts Views on Vision4Press platform.
Data correspond to usage on the plateform after 2015. The current usage metrics is available 48-96 hours after online publication and is updated daily on week days.
Initial download of the metrics may take a while.