Fig. 1
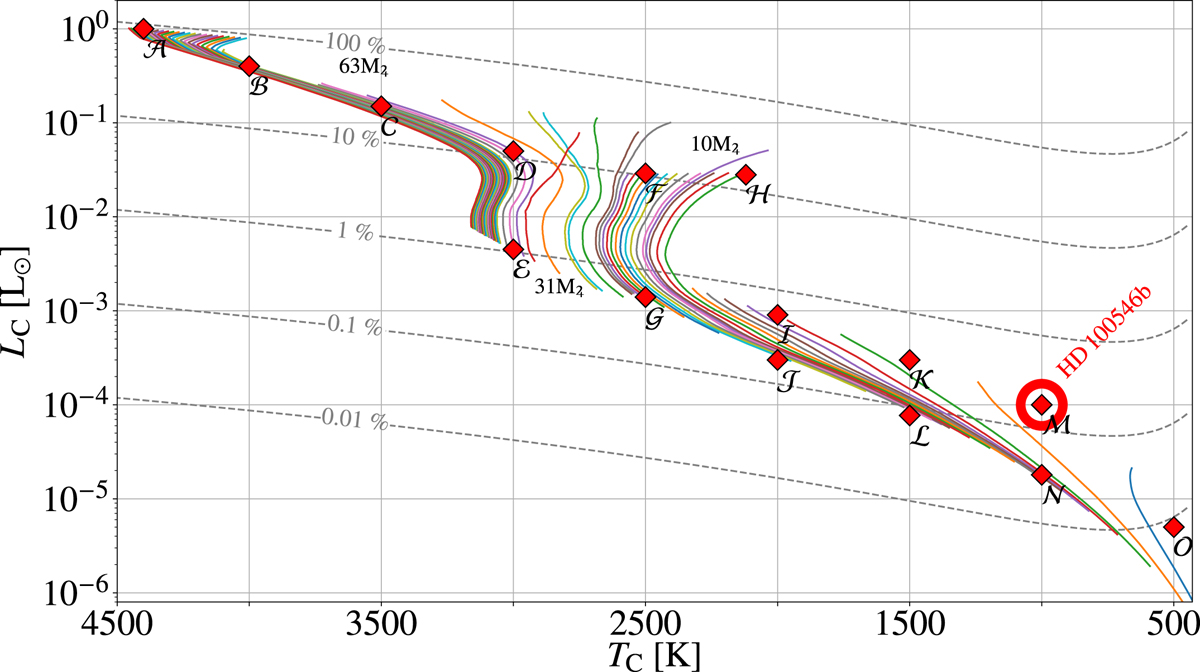
Parameter space of the selected effective temperatures Tc and luminosities Lc of the embedded companions. The coloured, solid lines show evolutionary tracks of planets and brown dwarfs as computed by Burrows et al. (1993, 1997). Sources used in our simulations are marked with red diamonds and indexed by letters (𝒜–𝒪) in the figure. The corresponding values for Tc and Lc are compiled in Table 1. The grey, dashed contour lines indicate the flux ratio between secondary and primary source in the M band (λ = 5 μm). As a comparison, the derived properties of HD 100546b from Quanz et al. (2015) are also indicated.
Current usage metrics show cumulative count of Article Views (full-text article views including HTML views, PDF and ePub downloads, according to the available data) and Abstracts Views on Vision4Press platform.
Data correspond to usage on the plateform after 2015. The current usage metrics is available 48-96 hours after online publication and is updated daily on week days.
Initial download of the metrics may take a while.