Fig. 4
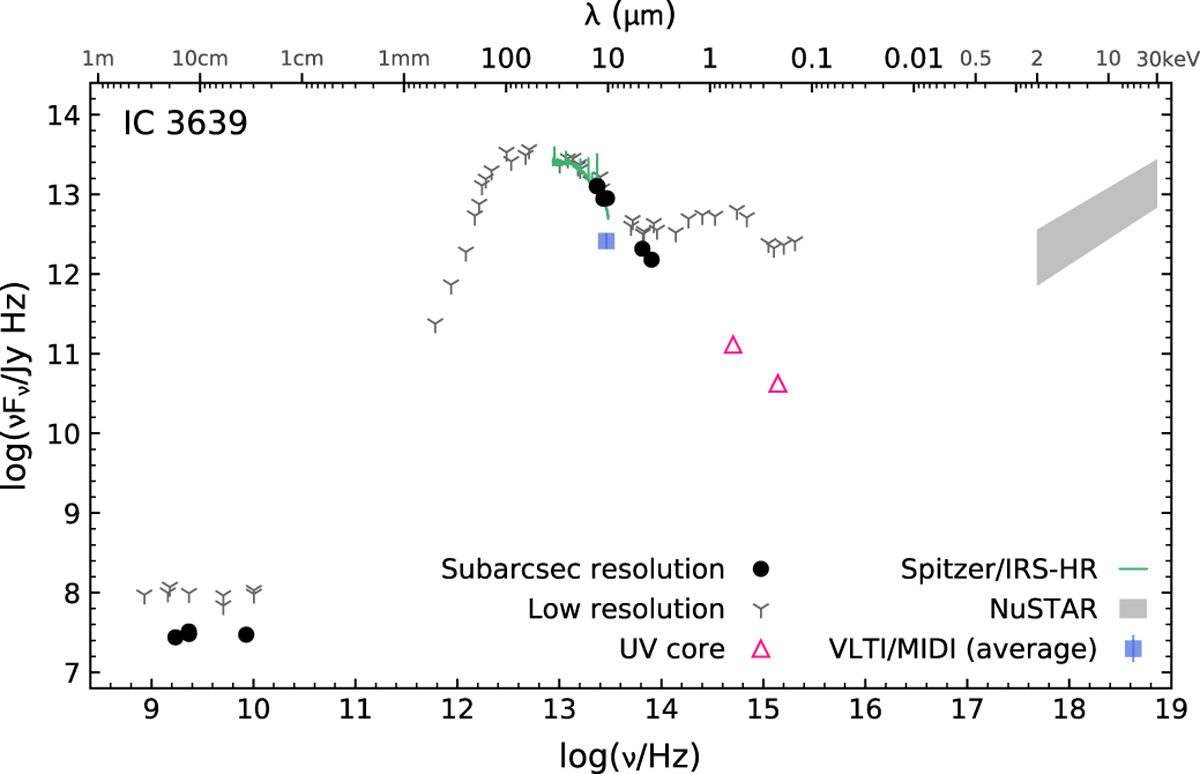
SED for the nucleus of IC 3639 at a ≲ 0.′′ 4 resolution (black dots), compared with the MIDI measurement (blue square) and the Spitzer/IRS-HR “optimal differential” spectrum from the CASSIS atlas (darkgreen line). Grey spikes represent the low spatial resolution measurements, i.e. the integrated SED of the host galaxy. Violet triangles correspond to the UV core. The grey-shaded area indicates the 2–10 keV and 0.5–30 keV intrinsic fluxes estimated for the models T and M in Boorman et al. (2016).
Current usage metrics show cumulative count of Article Views (full-text article views including HTML views, PDF and ePub downloads, according to the available data) and Abstracts Views on Vision4Press platform.
Data correspond to usage on the plateform after 2015. The current usage metrics is available 48-96 hours after online publication and is updated daily on week days.
Initial download of the metrics may take a while.