Fig. 3
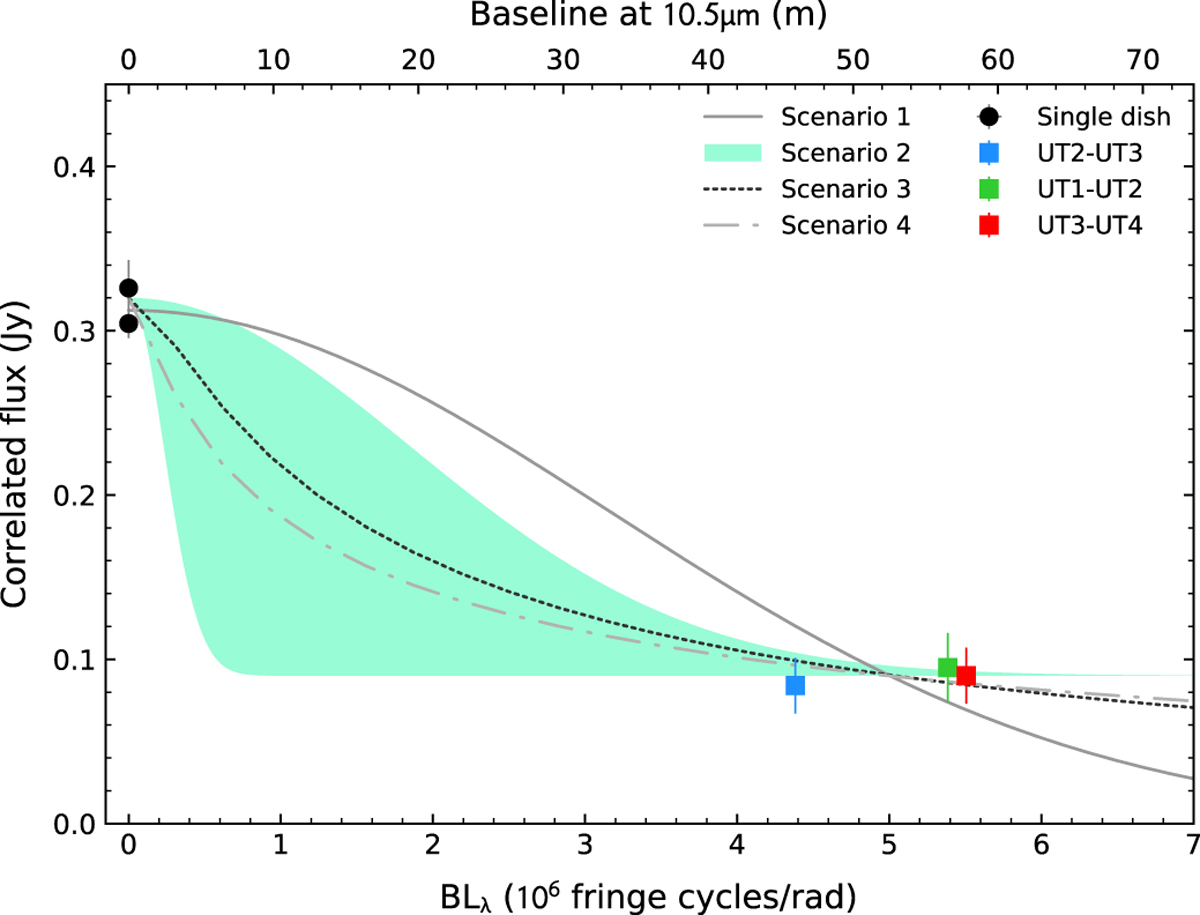
Black dots: total flux measured by single-dish telescopes (VISIR/PAH2 and T-ReCS/N band), filled squares: correlated fluxes measured by MIDI. Four possible scenarios are shown: a compact Gaussian distribution with FWHM = 5.8 ± 0.3 pc (grey solid line); an unresolved source plus a partially resolved Gaussian component of ~ 10–80 pc (core-haloconfiguration; light green-shaded area); a power-law distribution with an inner radius of Rin = 0.08 pc, a half-light radius of R1∕2 = 1.8 pc, an extended dust density distribution (α = 0.5), and a temperature gradient index for ISM grains (β = −0.36; black dotted line); a power-law distribution with an inner radius of Rin = 0.4 pc, R1∕2 = 7.3 pc, a flat density distribution (α = 0), and a temperature gradient index for ISM grains (β = −0.36; grey dot-dashed line).
Current usage metrics show cumulative count of Article Views (full-text article views including HTML views, PDF and ePub downloads, according to the available data) and Abstracts Views on Vision4Press platform.
Data correspond to usage on the plateform after 2015. The current usage metrics is available 48-96 hours after online publication and is updated daily on week days.
Initial download of the metrics may take a while.