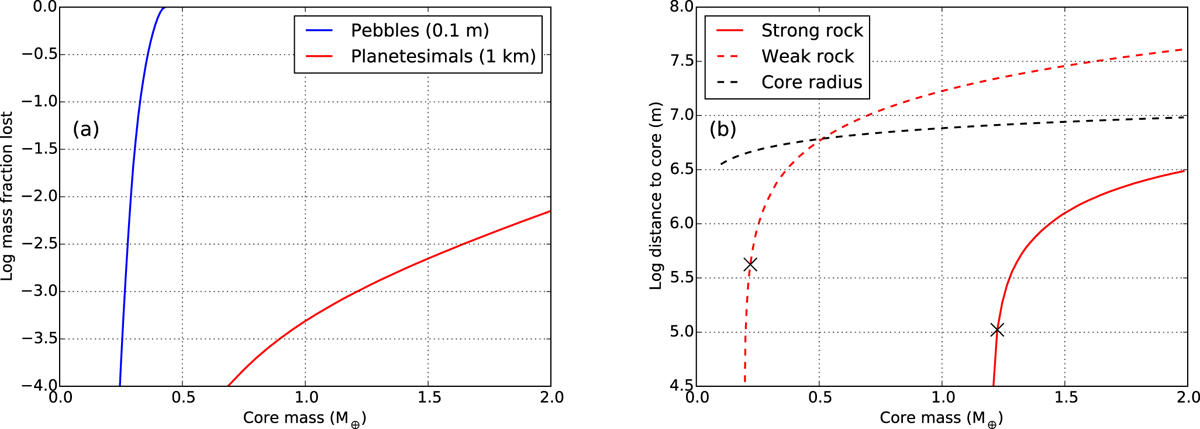
Fig. 5

Mass deposition by planetesimals. Left panel: ablation curves for 1 km planetesimals (red line) and 0.1 m pebbles (blue line) impacting a growing protoplanet, ignoring fragmentation. Planetesimal ablation rates are limited to approximately 1% up to a core mass of 2 M⊕ , whereas the pebbles are fully evaporated before 0.5 M⊕ . Right panel: breakup distances for strong (100 MPa, red solid curve) and weak rock (1 MPa, red dashed curve). The black dashed curve follows the core radius. The crosses represent the points at which the planetesimals have enough timeto radially spread to twice their initial radius. All plotted curves are almost identical for both enrichment assumptions (rainout plotted).
Current usage metrics show cumulative count of Article Views (full-text article views including HTML views, PDF and ePub downloads, according to the available data) and Abstracts Views on Vision4Press platform.
Data correspond to usage on the plateform after 2015. The current usage metrics is available 48-96 hours after online publication and is updated daily on week days.
Initial download of the metrics may take a while.


