Fig. 2

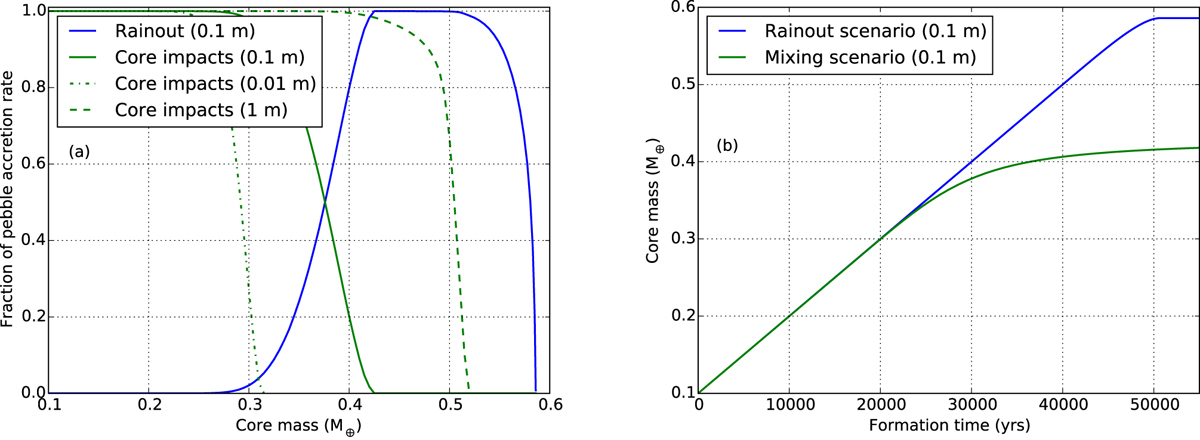
Core growth by pebble accretion. Left panel: mass fractions of solids impacting the core directly (green curves) or reaching the core by rainout of ablated material (blue curve). The differently spaced green curves correspond to three sizes of pebbles: 0.1 m (solid), 1 m (dashed), 0.01 m (dash-dotted). Right panel: growth of the core over time. In this figure, the rainout scenario is indicated by the blue curve and the mixing case is shown by the green curve. Both curves in panel b correspond to 0.1 m impactors.
Current usage metrics show cumulative count of Article Views (full-text article views including HTML views, PDF and ePub downloads, according to the available data) and Abstracts Views on Vision4Press platform.
Data correspond to usage on the plateform after 2015. The current usage metrics is available 48-96 hours after online publication and is updated daily on week days.
Initial download of the metrics may take a while.


