Fig. 2
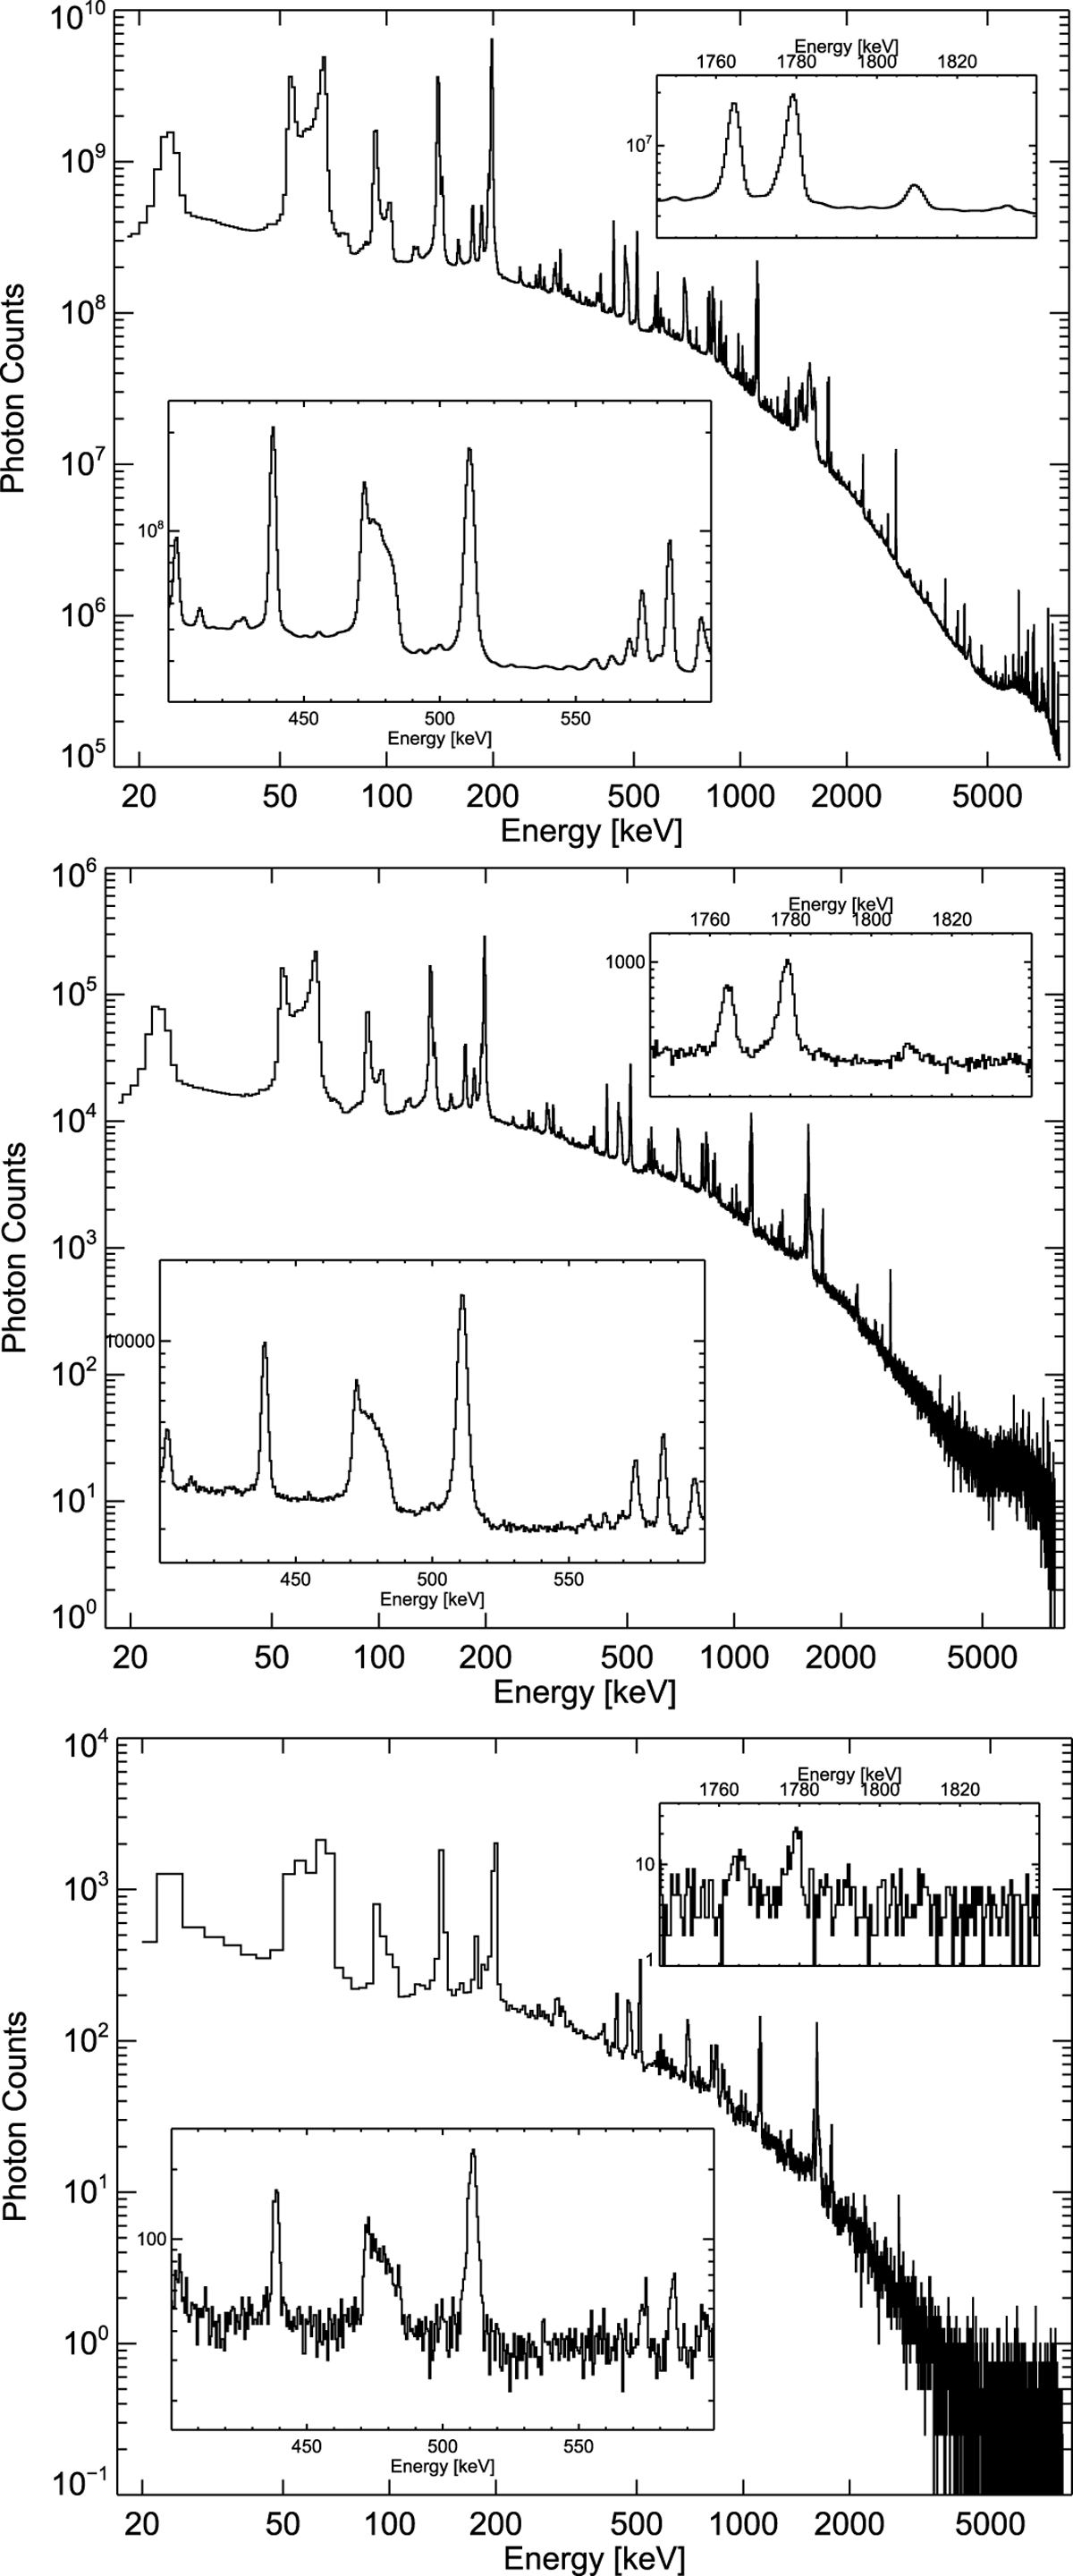
Energy spectra measured with SPI during the INTEGRAL mission. Above: mission-integrated all-detector spectrum (orbits 43-1730). This allows us to identify even the weakest background features. Inserts show spectral regions near the two brightest celestial lines, the 511 keV line from positron annihilation (lower-left), and the 26Al line at 1809 keV from diffuse nucleosynthesis throughout the Galaxy (upper-right). Middle and below: same spectrum, now accumulated just for detector No. 0 and orbit No. 1000 (middle) , and for one detector (No. 0) and one pointing (below).
Current usage metrics show cumulative count of Article Views (full-text article views including HTML views, PDF and ePub downloads, according to the available data) and Abstracts Views on Vision4Press platform.
Data correspond to usage on the plateform after 2015. The current usage metrics is available 48-96 hours after online publication and is updated daily on week days.
Initial download of the metrics may take a while.