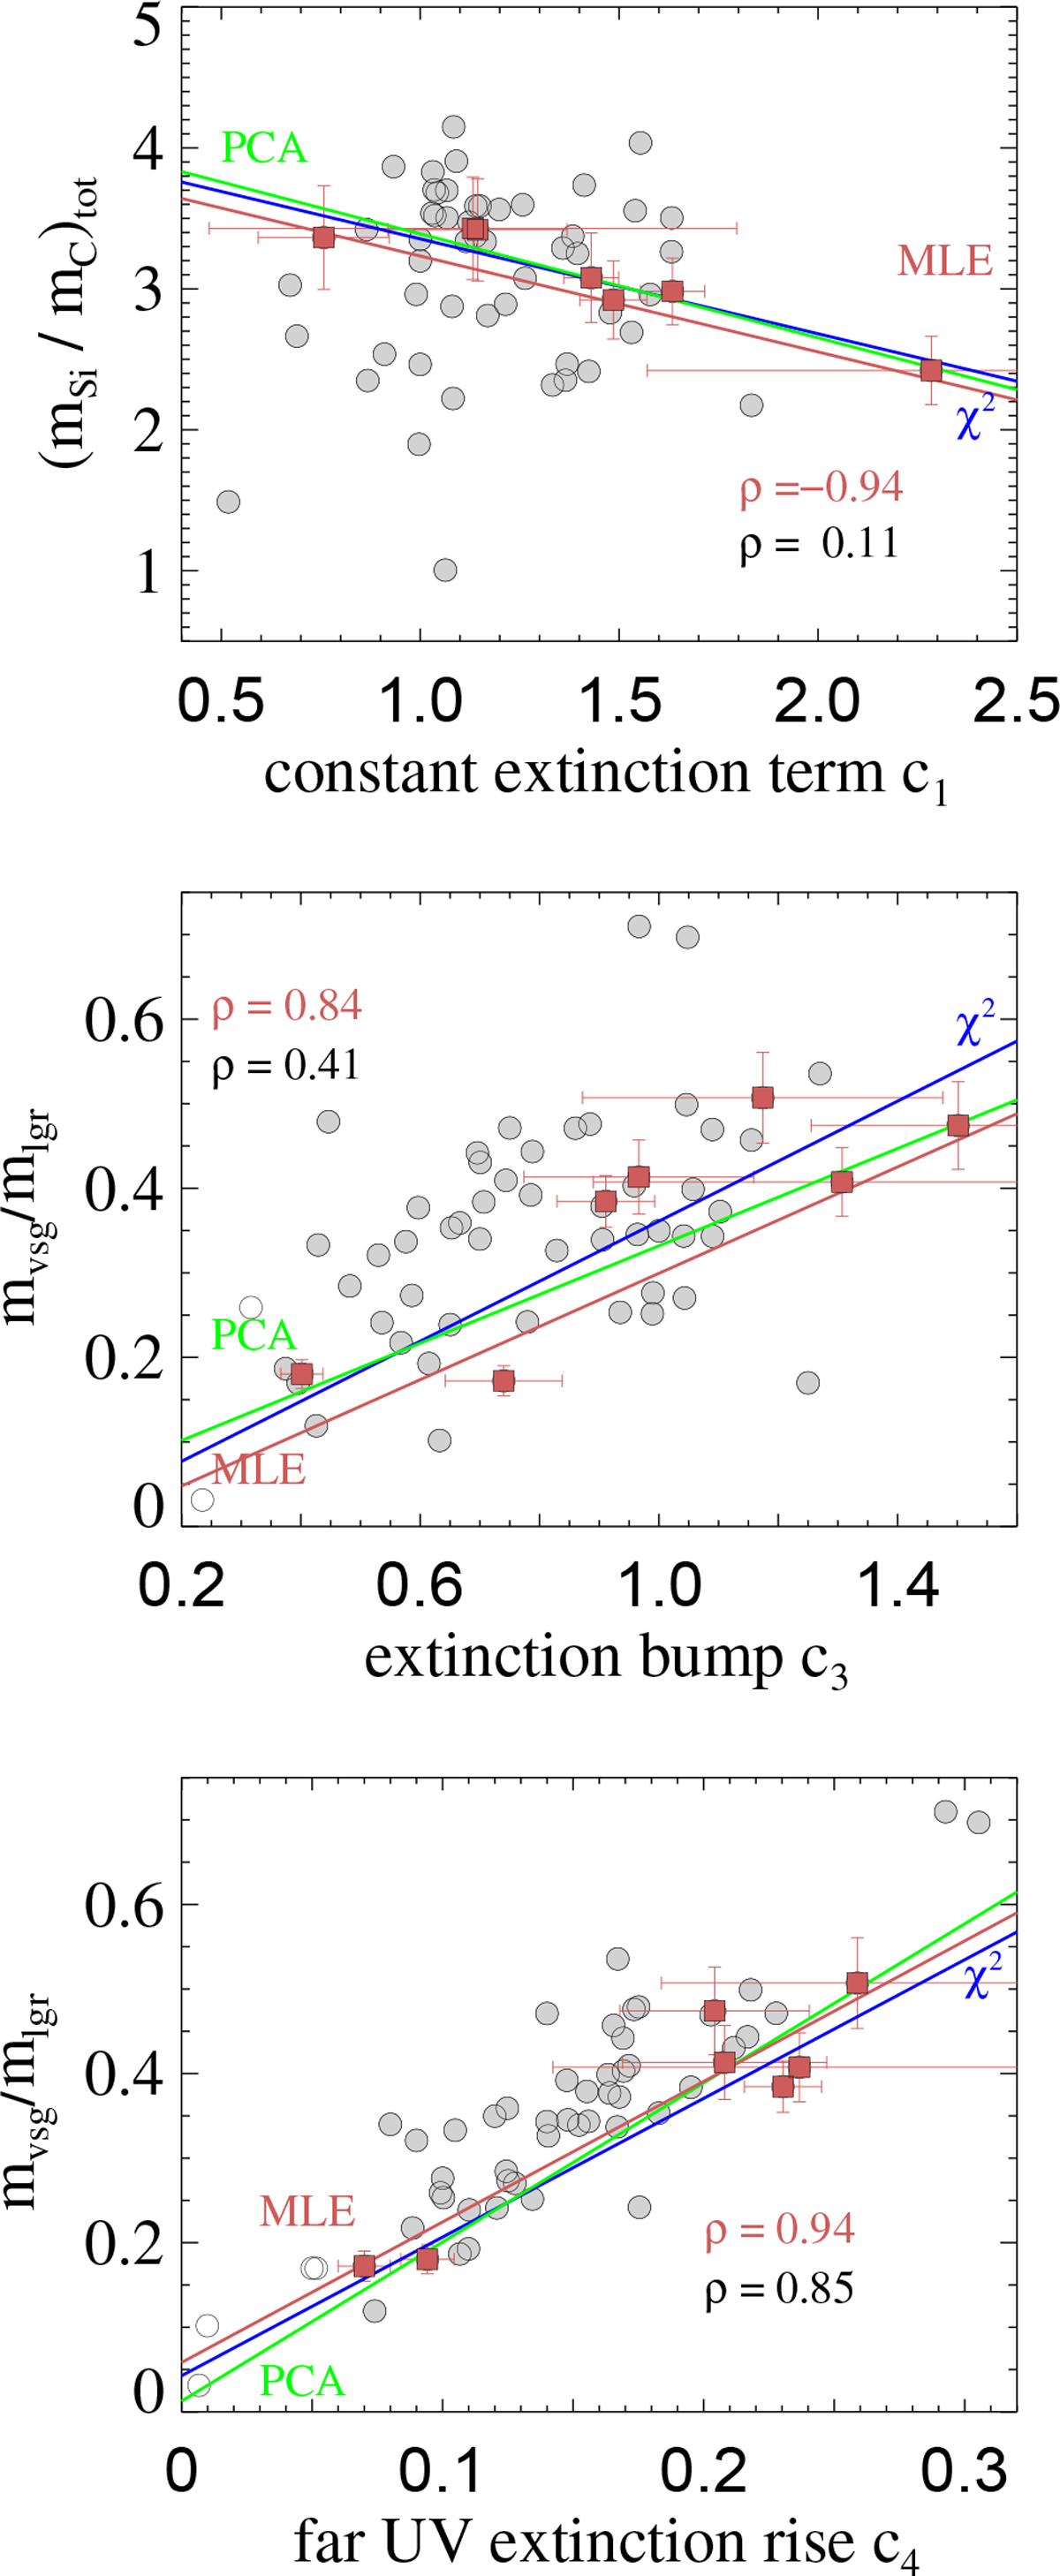
Fig. 6

Top panel: mass ratio of silicate and carbon dust versus the constant term c1 of Eq. (2) in observations of the extinction curve between 115–330 nm (Valencic et al. 2004; Gordon et al. 2009). Mid panel: mass ratio of very small (r < 6 nm) and large grains versus the parameter c3 of Eq. (2); the parameter c3 describes the strength of the extinction bump. Bottom panel: mass ratio of very small (r < 6 nm) and large grains versus the parameter c4 of Eq. (2), which describes the strength of the far UV rise. The L-sample is shown with open circles and the LS -sample with grey filled circles together with their Pearson coefficient (black). Single-cloud sight-lines (red squares) with 1σ error bars and Pearson coefficient are shown in red. They are fit by straight lines employing the MLE (red solid line), PCA (green solid line), and minimum χ2 (blue solid line) method.
Current usage metrics show cumulative count of Article Views (full-text article views including HTML views, PDF and ePub downloads, according to the available data) and Abstracts Views on Vision4Press platform.
Data correspond to usage on the plateform after 2015. The current usage metrics is available 48-96 hours after online publication and is updated daily on week days.
Initial download of the metrics may take a while.


