Free Access
Fig. 5
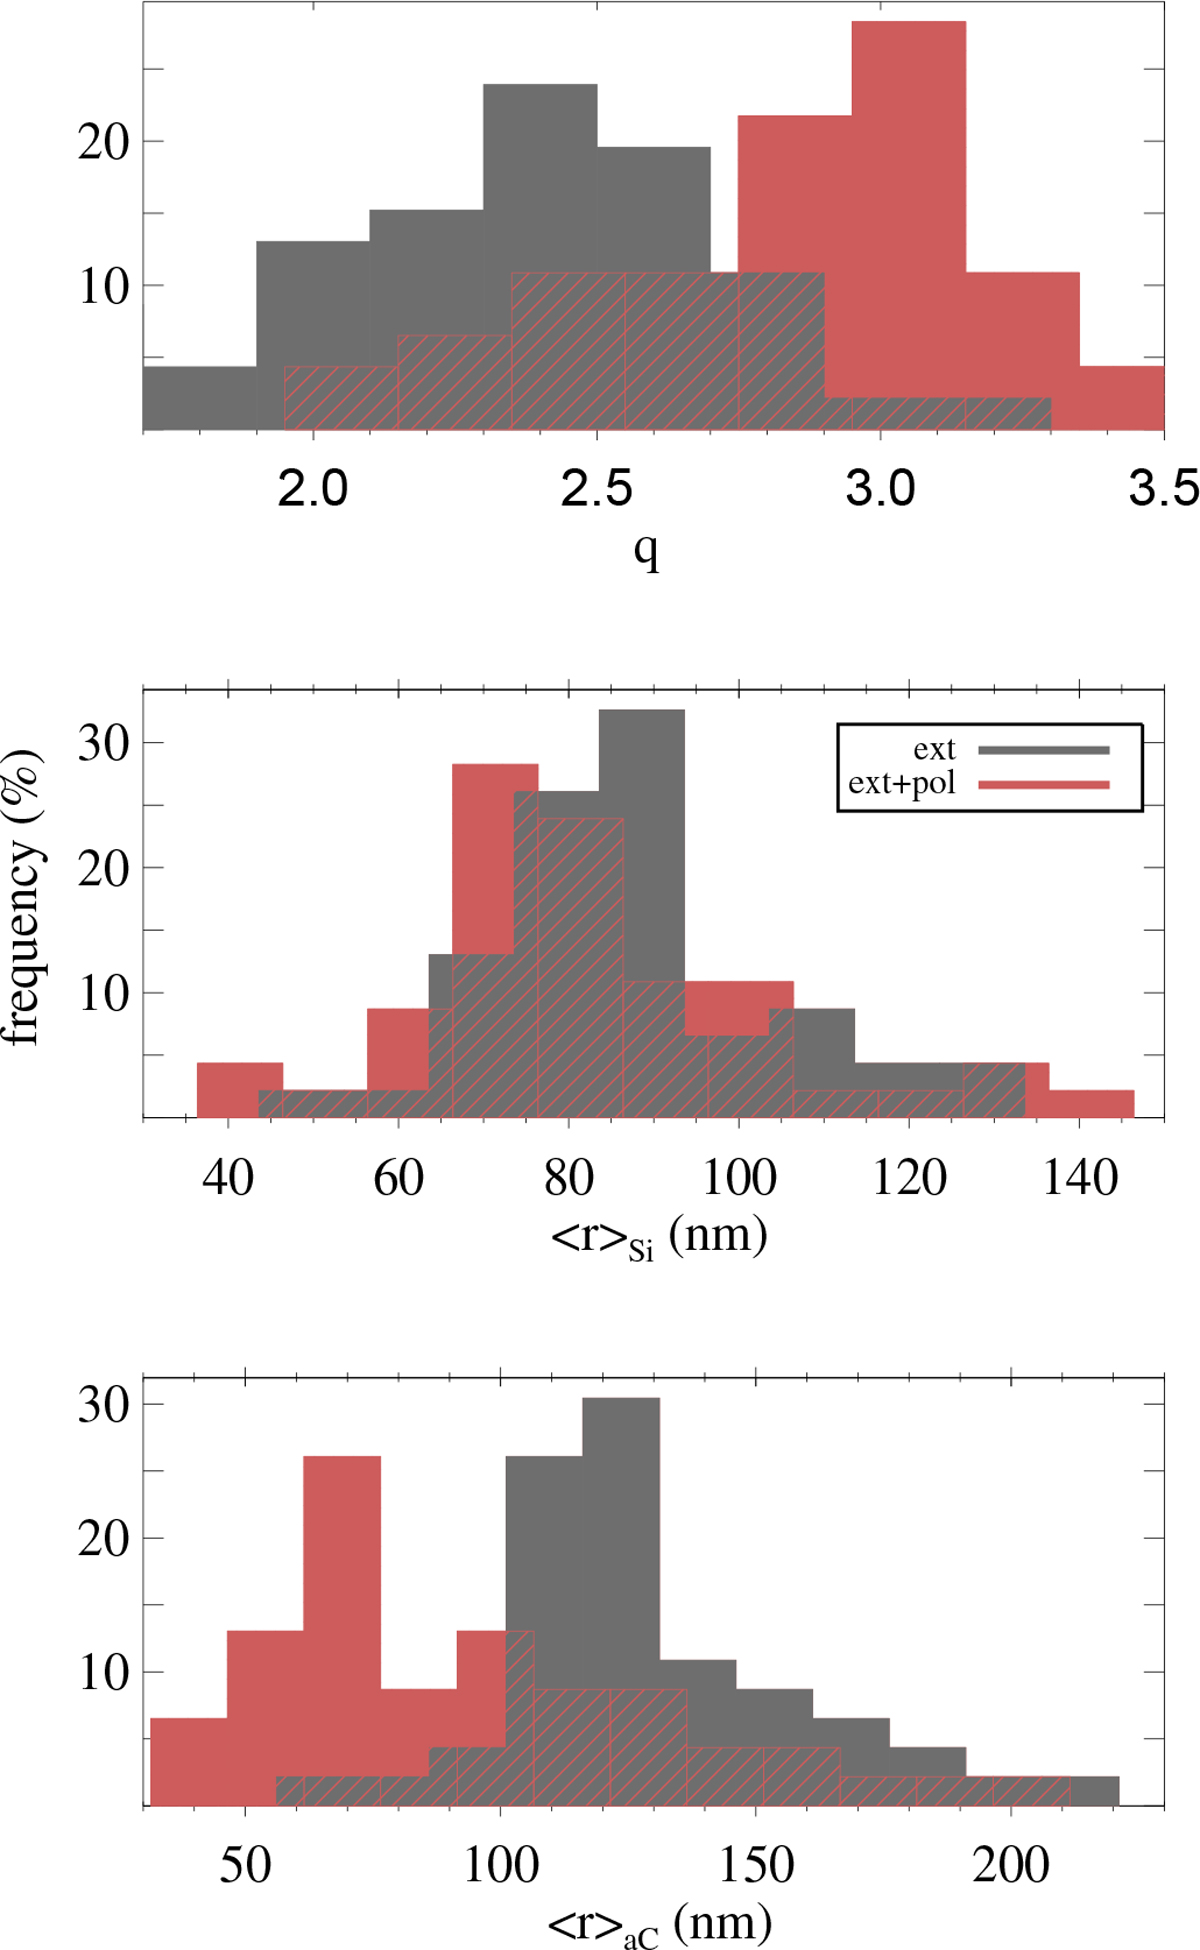
Histograms of the exponent of the size distribution (top) and mean sizes of silicates (middle) and amorphous carbon (bottom) forthe LIPS sample when fitting extinction and polarisation (shaded area in red) and extinction only (shaded area in grey). The intersection of both samples is shown as grey-red hatched area.
Current usage metrics show cumulative count of Article Views (full-text article views including HTML views, PDF and ePub downloads, according to the available data) and Abstracts Views on Vision4Press platform.
Data correspond to usage on the plateform after 2015. The current usage metrics is available 48-96 hours after online publication and is updated daily on week days.
Initial download of the metrics may take a while.