Fig. 4
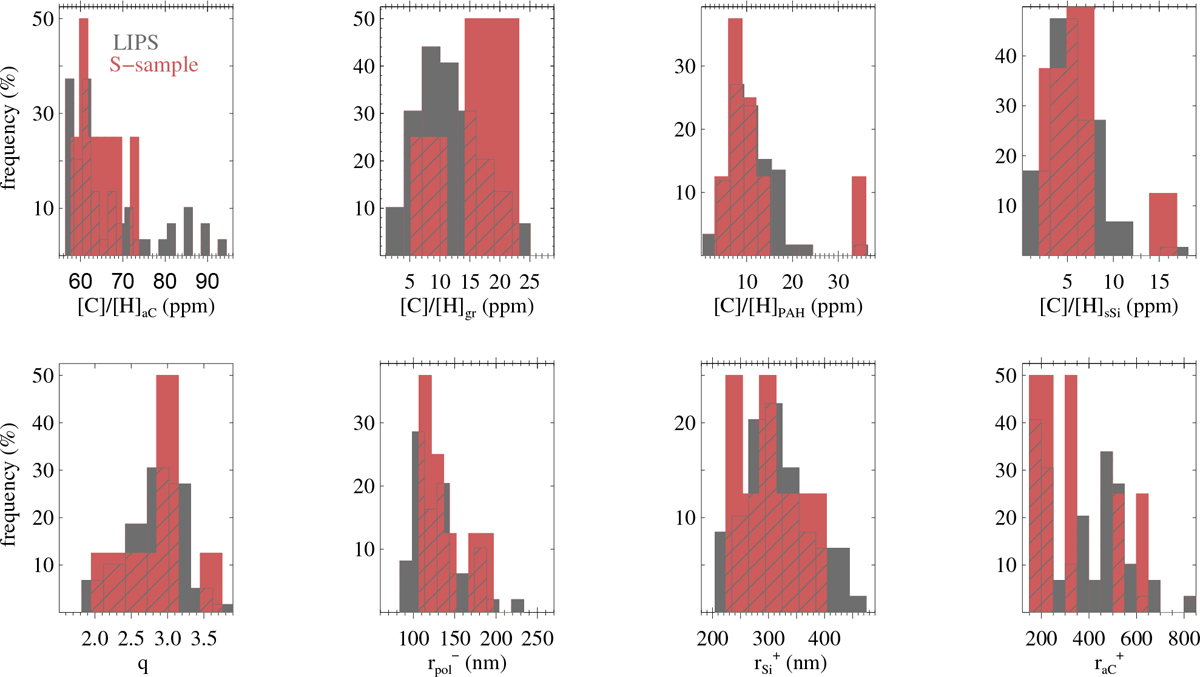
Histograms of best-fit parameters for all stars of the LIPS sample (shaded area in grey) and the single-cloud sight-lines (shaded area in red). The intersection of both samples is shownas red-grey hatched area. In the top panels we show (from left to right) the dust abundances [C]/[H]aC, [C]/[H]gr, [C]/[H]PAH, and [Si]/[H]sSi, and in the bottom panels q, ![]() ,
, ![]() , and
, and ![]() , respectively.
, respectively.
Current usage metrics show cumulative count of Article Views (full-text article views including HTML views, PDF and ePub downloads, according to the available data) and Abstracts Views on Vision4Press platform.
Data correspond to usage on the plateform after 2015. The current usage metrics is available 48-96 hours after online publication and is updated daily on week days.
Initial download of the metrics may take a while.