Free Access
Fig. 3
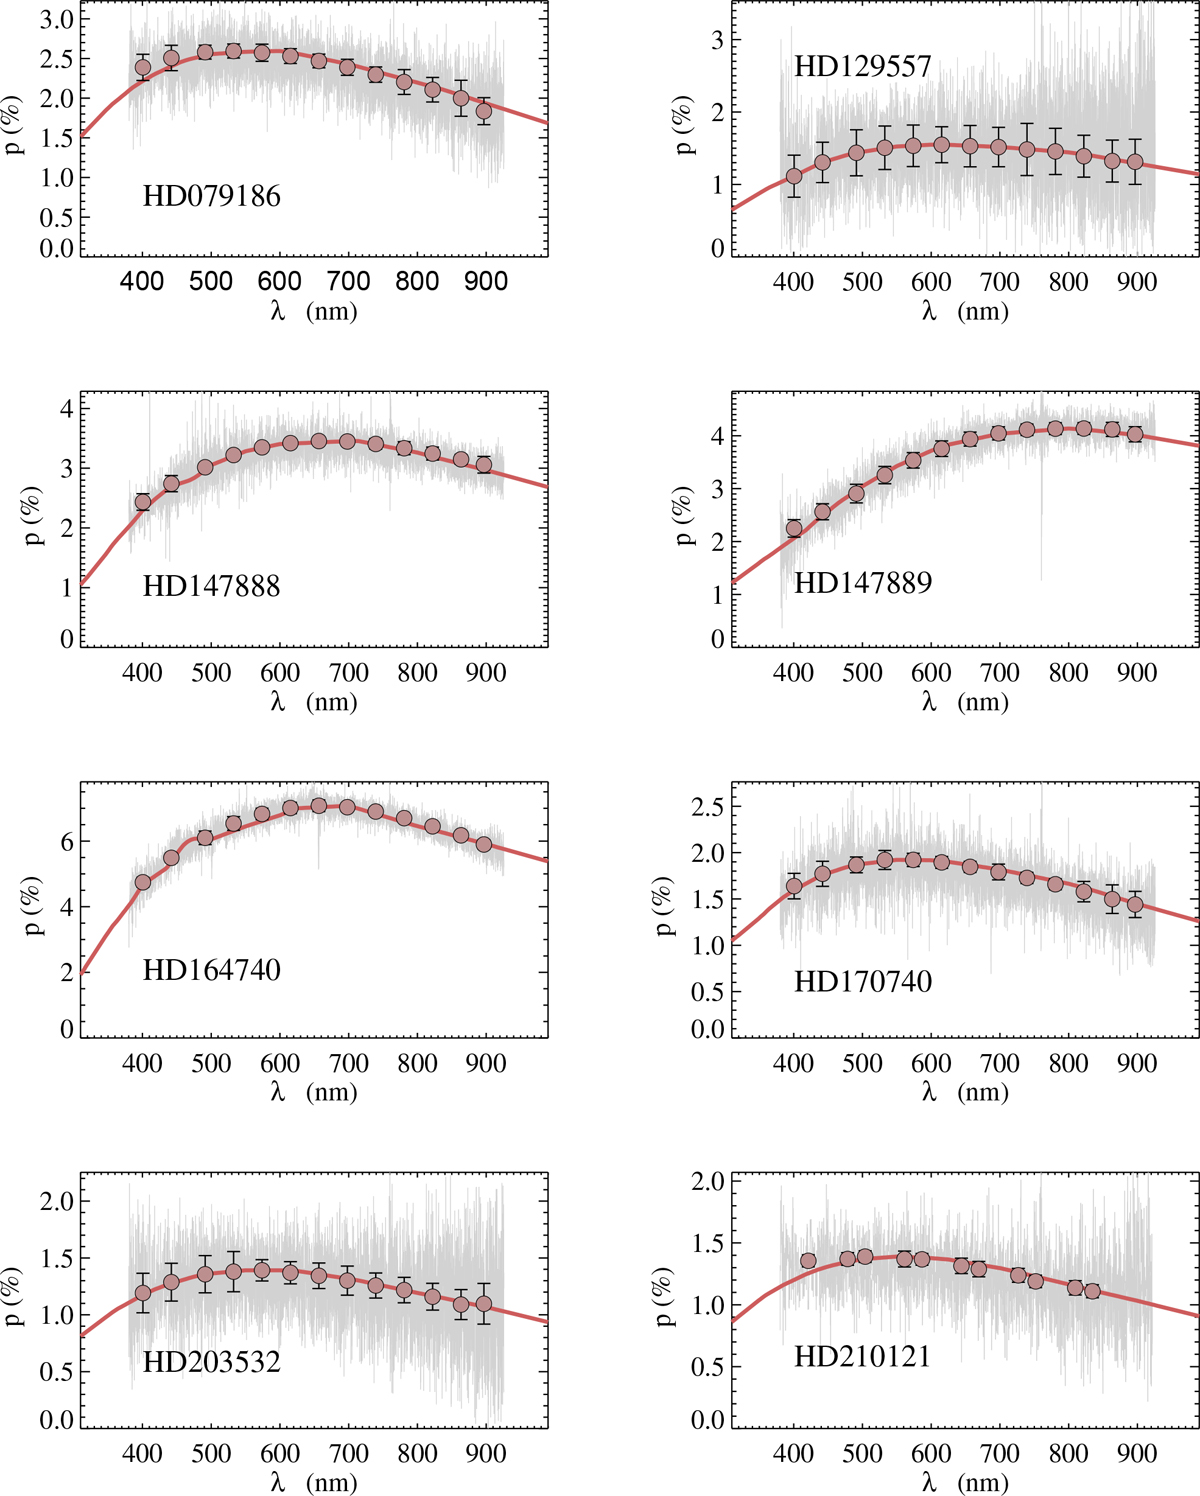
Polarisation curves of single-cloud sight-lines. The polarisation spectra obtained with FORS2 are shown with grey lines; the filled circles (with 1σ error bars) show the same data rebinned to a spectral resolution of λ∕Δλ ~ 50. The best-fit obtained with our dust model is shown with a brown solid line.
Current usage metrics show cumulative count of Article Views (full-text article views including HTML views, PDF and ePub downloads, according to the available data) and Abstracts Views on Vision4Press platform.
Data correspond to usage on the plateform after 2015. The current usage metrics is available 48-96 hours after online publication and is updated daily on week days.
Initial download of the metrics may take a while.