Fig. 2
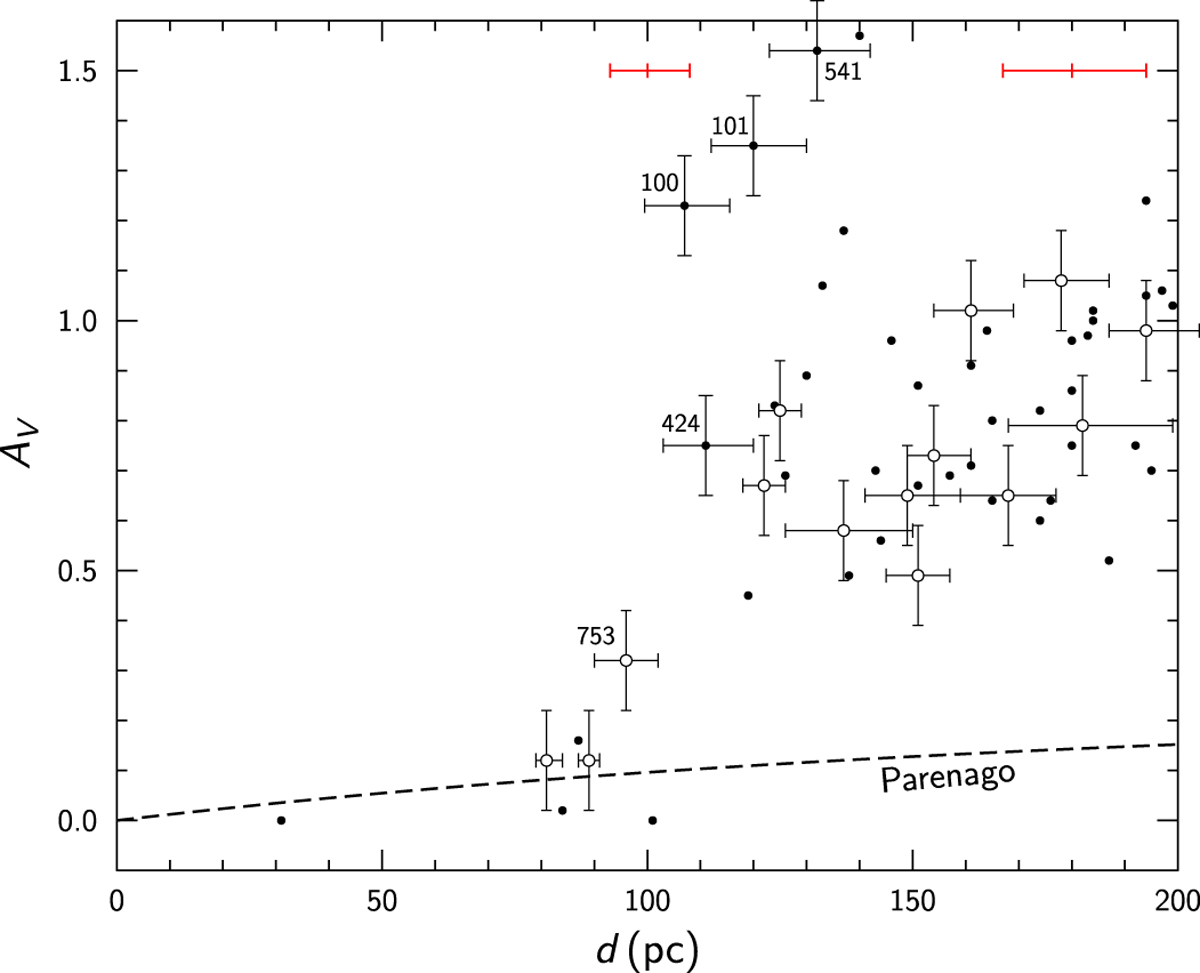
Dependence of the extinction on distance for the investigated area up to d = 200 pc. Stars with photometric distances are plotted as dots and stars with Gaia distances as circles. The stars with Gaia distances and four numbered stars withphotometric distances on the rising part of the extinction are shown with the error crosses. The black broken curve designates the extinction rise with distance in the diffuse Galactic dust layer for b = +36.75° according to the exponential Parenago (1945) law.
Current usage metrics show cumulative count of Article Views (full-text article views including HTML views, PDF and ePub downloads, according to the available data) and Abstracts Views on Vision4Press platform.
Data correspond to usage on the plateform after 2015. The current usage metrics is available 48-96 hours after online publication and is updated daily on week days.
Initial download of the metrics may take a while.