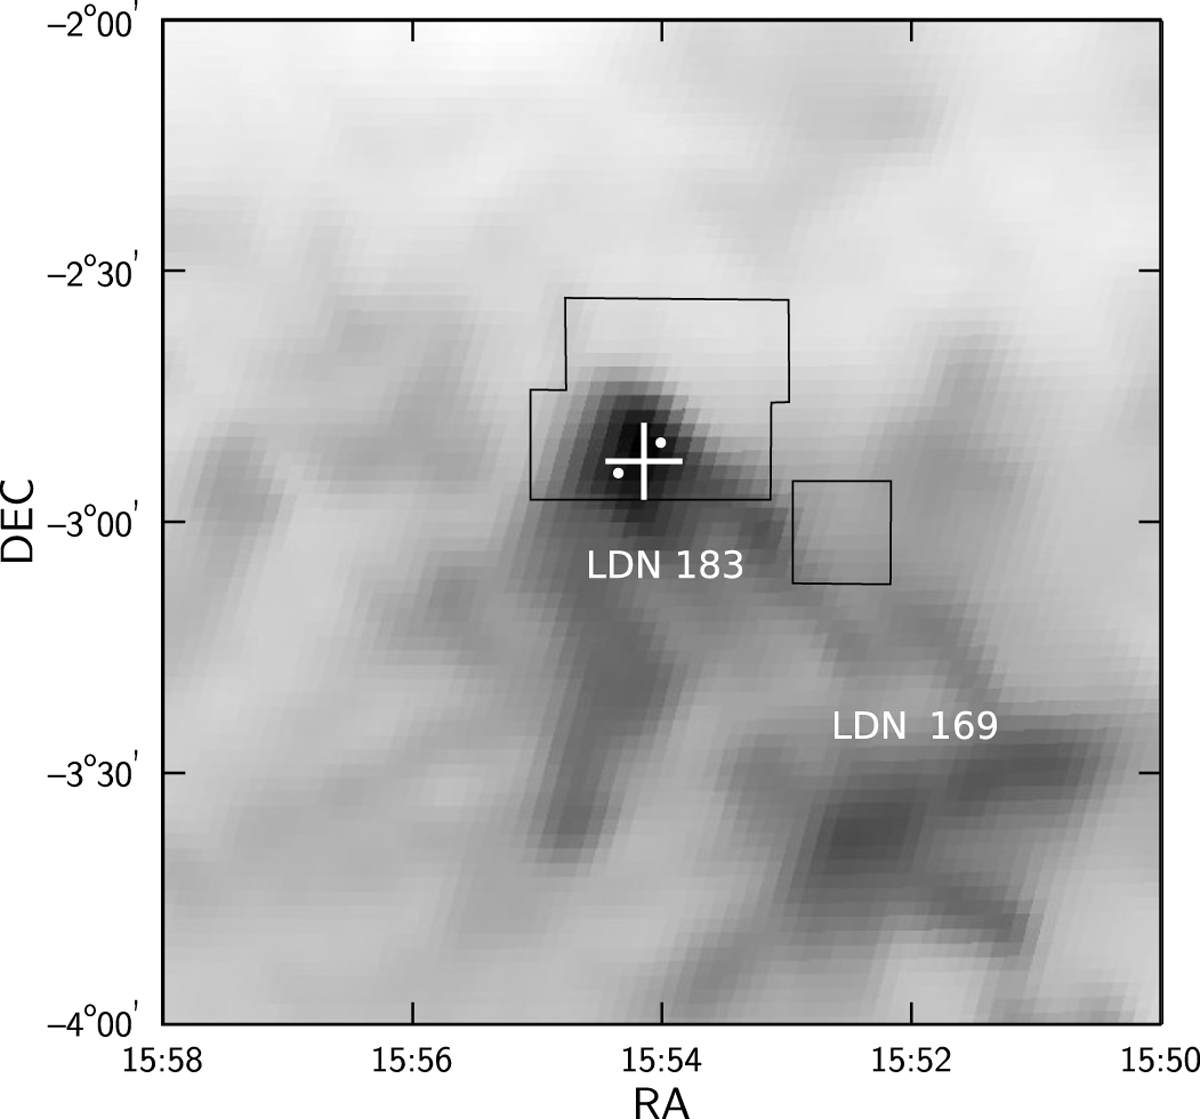
Fig. 1

Areas covered by observations in the Vilnius photometric system. The whole 2° × 2° area wasobserved with the Maksutov telescope of the Molėtai Observatory, and the seven 12′ × 12′ areas were observed with the VATT telescope. Six of them form a black irregular rectangle and the seventh is a separate black square. Two heavily reddened red giants, discussed in Section 4, are plotted as the white dots. The cross designates the position of the dust peak, according to Pagani et al. (2005). The background is a map of the thermal dust emission at 857 GHz (350 μm) measured by the Planck space mission and taken from the SkyView virtual observatory.
Current usage metrics show cumulative count of Article Views (full-text article views including HTML views, PDF and ePub downloads, according to the available data) and Abstracts Views on Vision4Press platform.
Data correspond to usage on the plateform after 2015. The current usage metrics is available 48-96 hours after online publication and is updated daily on week days.
Initial download of the metrics may take a while.


