Fig. 9
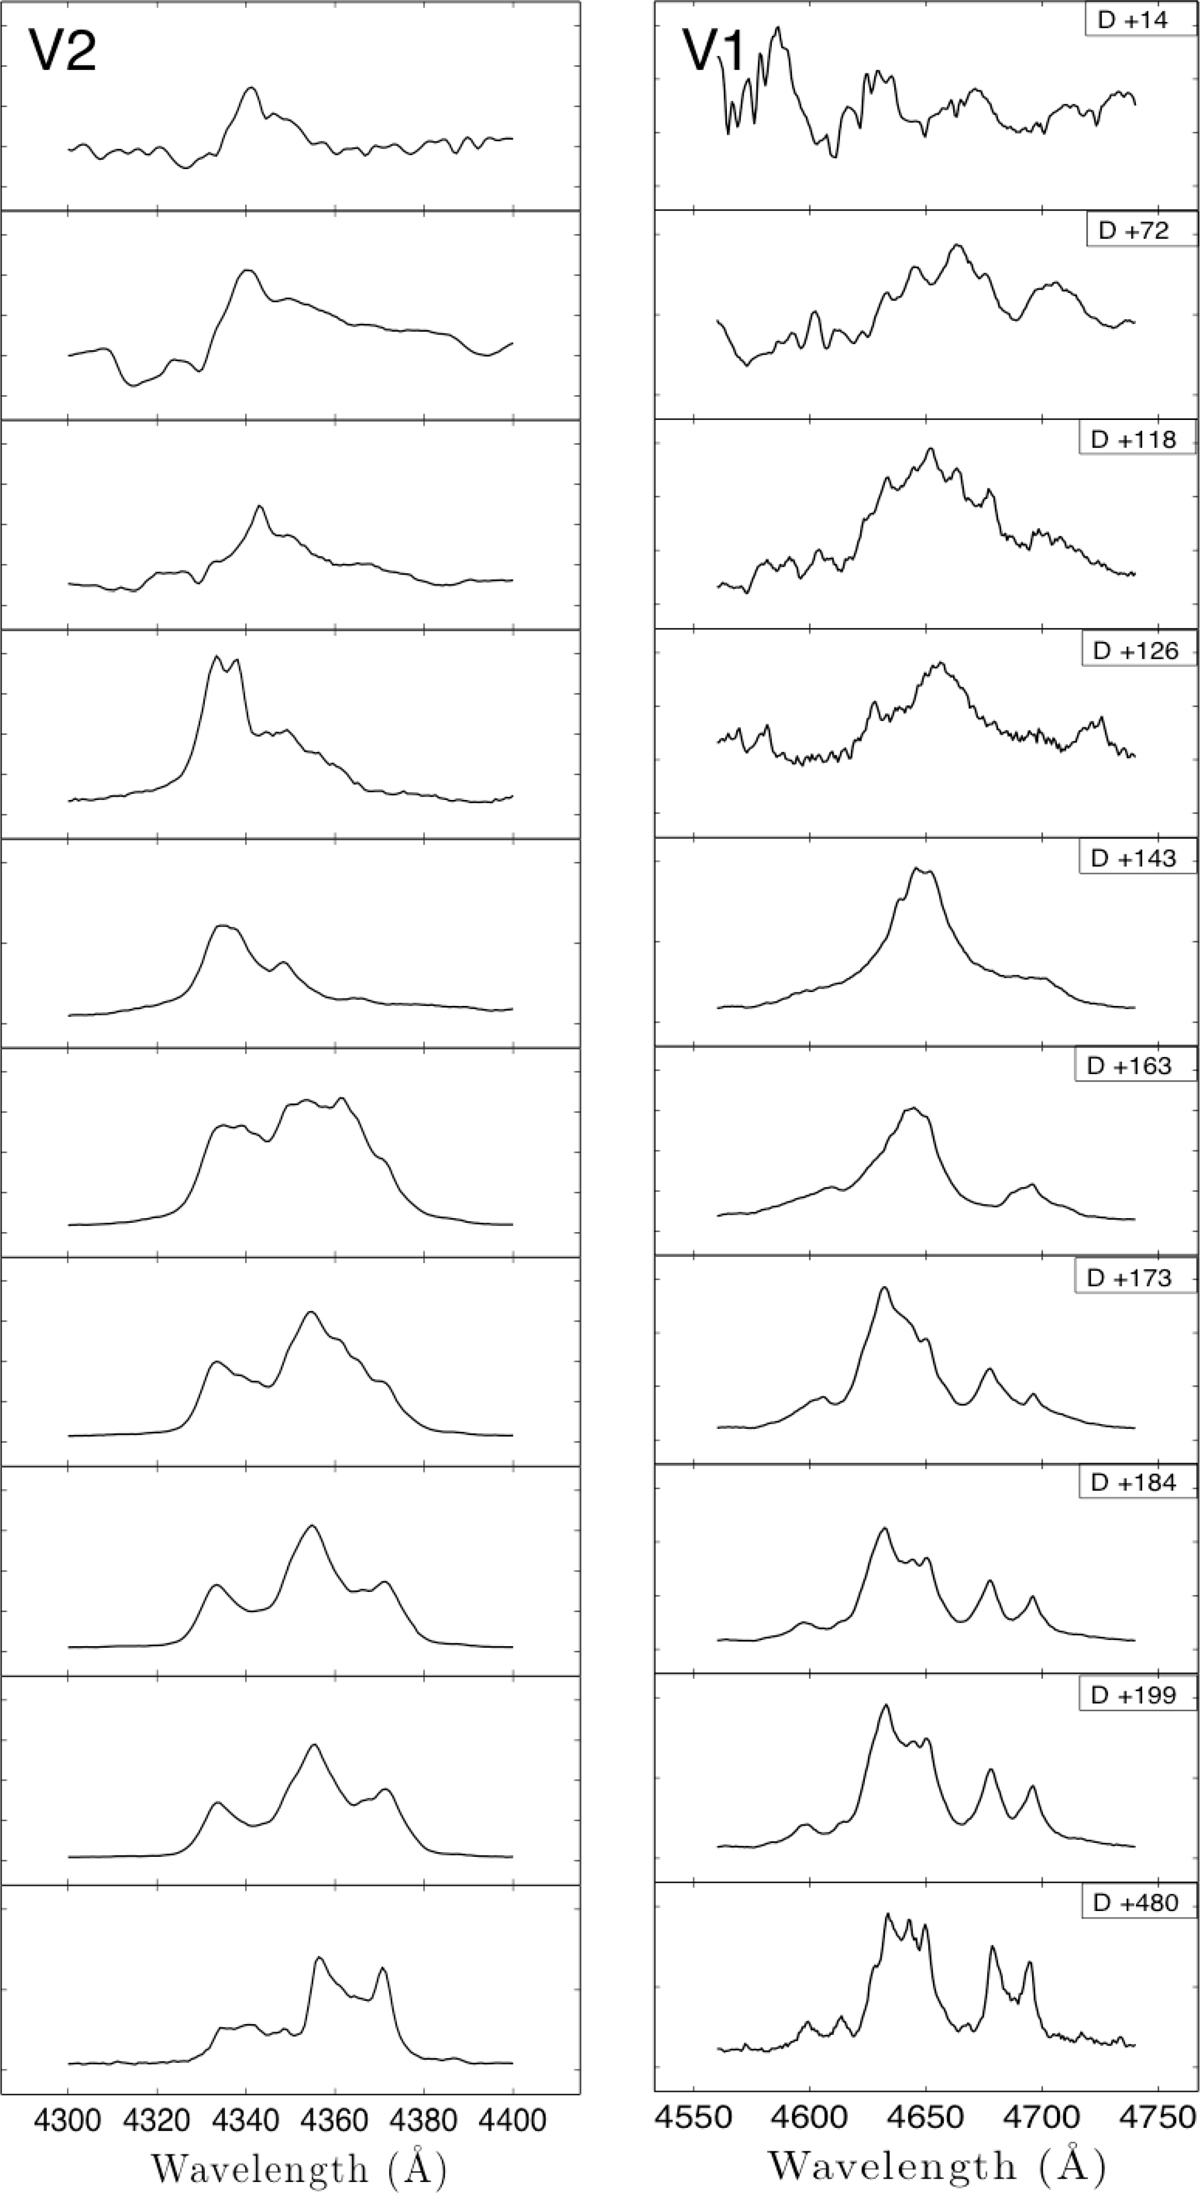
Temporal shape evolution of the blending lines in the area surrounding the 4341 Å and 4650 Å V2 and V1 oxygen multiplets. Days since detection are marked in the top-right-corner of each subplot in the V1 column. The most pronounced flaring episodes are between days 140–150 post-discovery. Note in the V1 multiplet column plot (right hand side) a saddle-shaped He II line at 4686 Å fits the 4676 and 4696 Å lines if they are the red and blue wings of the He II line.
Current usage metrics show cumulative count of Article Views (full-text article views including HTML views, PDF and ePub downloads, according to the available data) and Abstracts Views on Vision4Press platform.
Data correspond to usage on the plateform after 2015. The current usage metrics is available 48-96 hours after online publication and is updated daily on week days.
Initial download of the metrics may take a while.