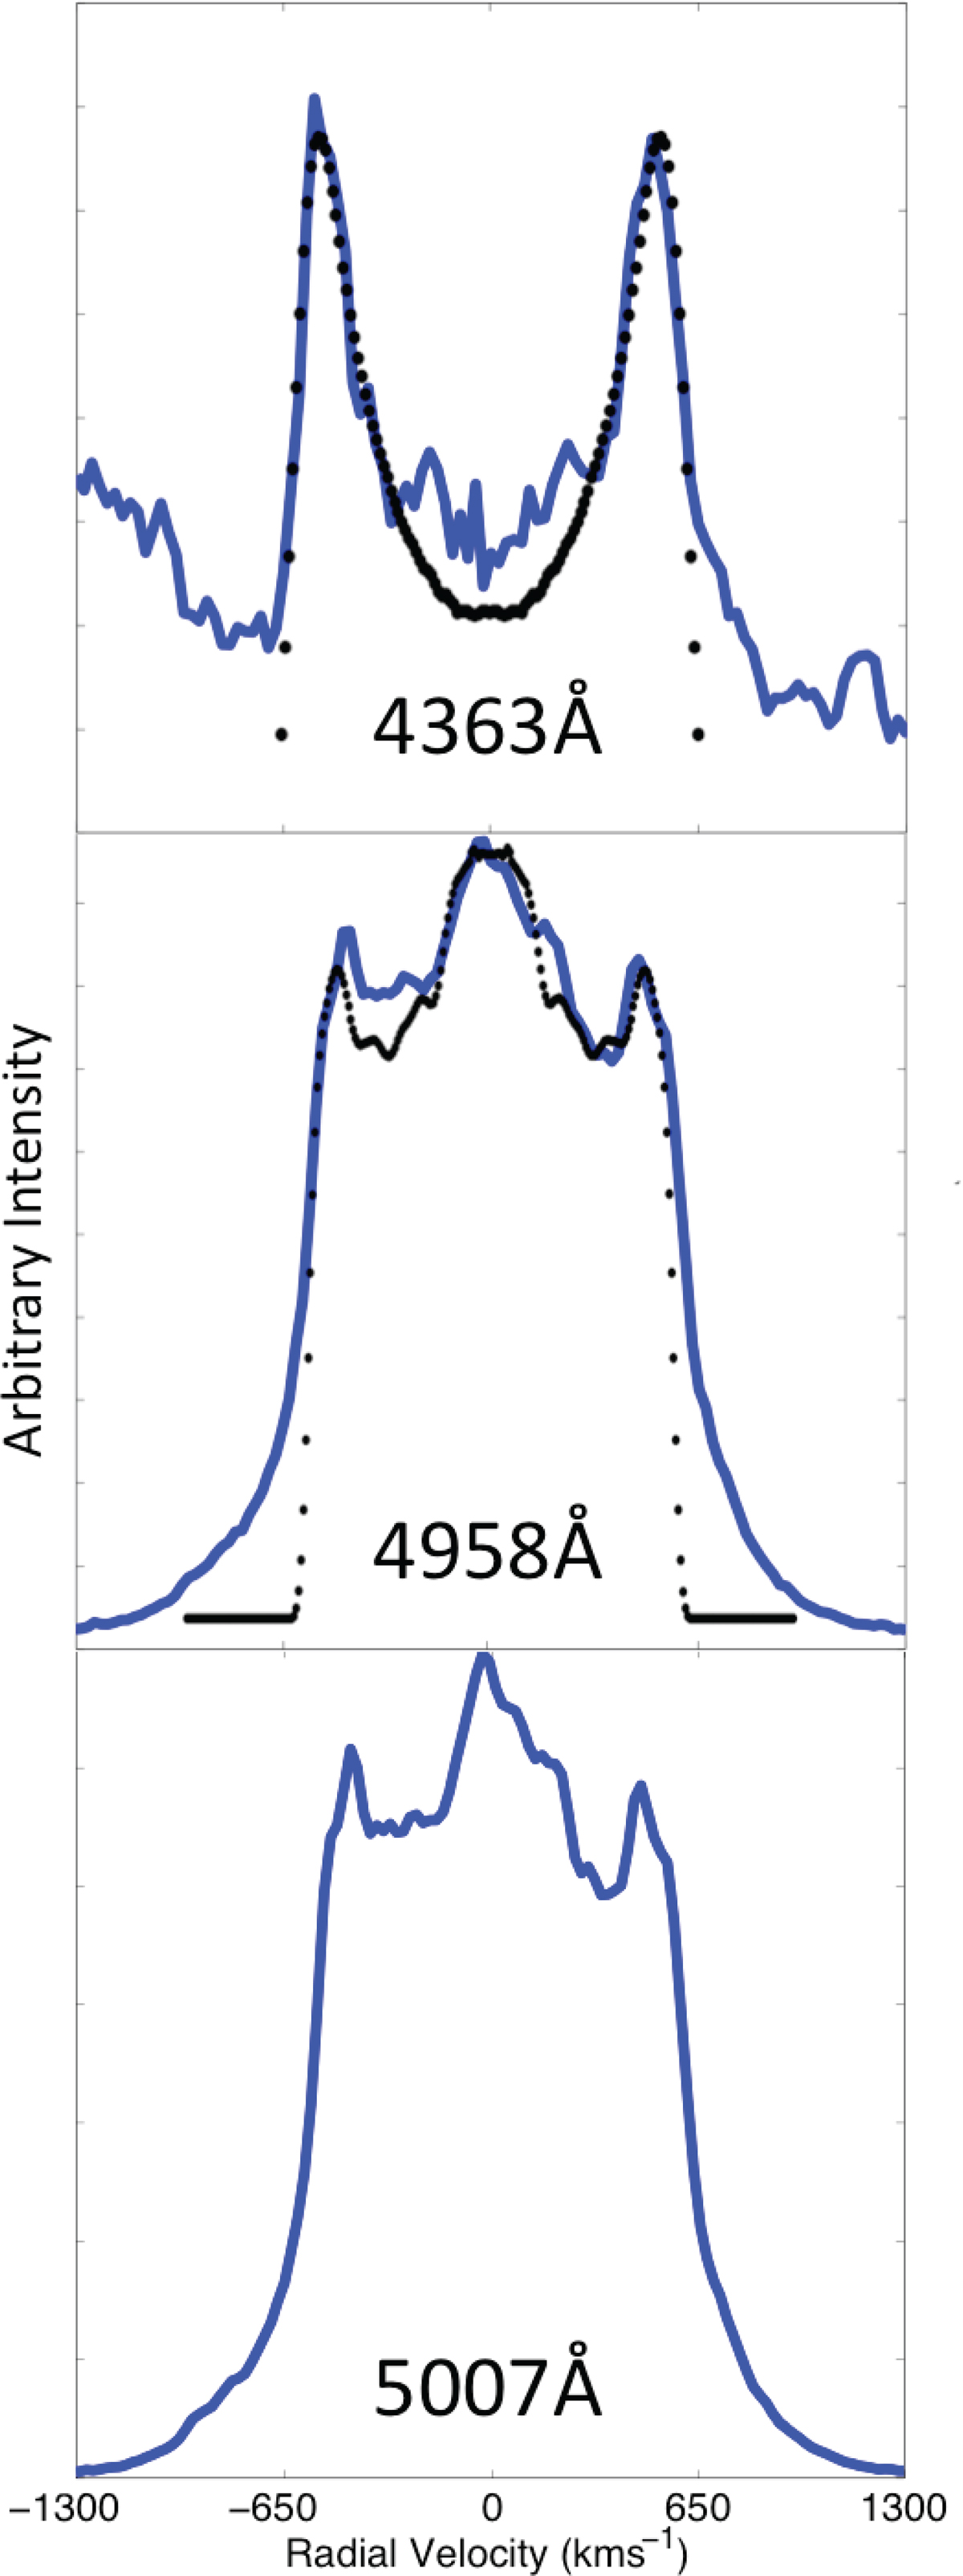
Fig. 7

Spectra of [O III] nebular and auroral lines on day 822 post-discovery. The observed line profiles (blue-solid lines) were used in the fitting of a morpho-kinematical model with the SHAPE software, seen as the overlaid black dots. The auroral line is fitted with an equatorial disk whereas the nebular lines fit an equatorial waist and polar cones morphology with a Hubble outflow velocity law, see Fig. 8.
Current usage metrics show cumulative count of Article Views (full-text article views including HTML views, PDF and ePub downloads, according to the available data) and Abstracts Views on Vision4Press platform.
Data correspond to usage on the plateform after 2015. The current usage metrics is available 48-96 hours after online publication and is updated daily on week days.
Initial download of the metrics may take a while.


