Fig. 3
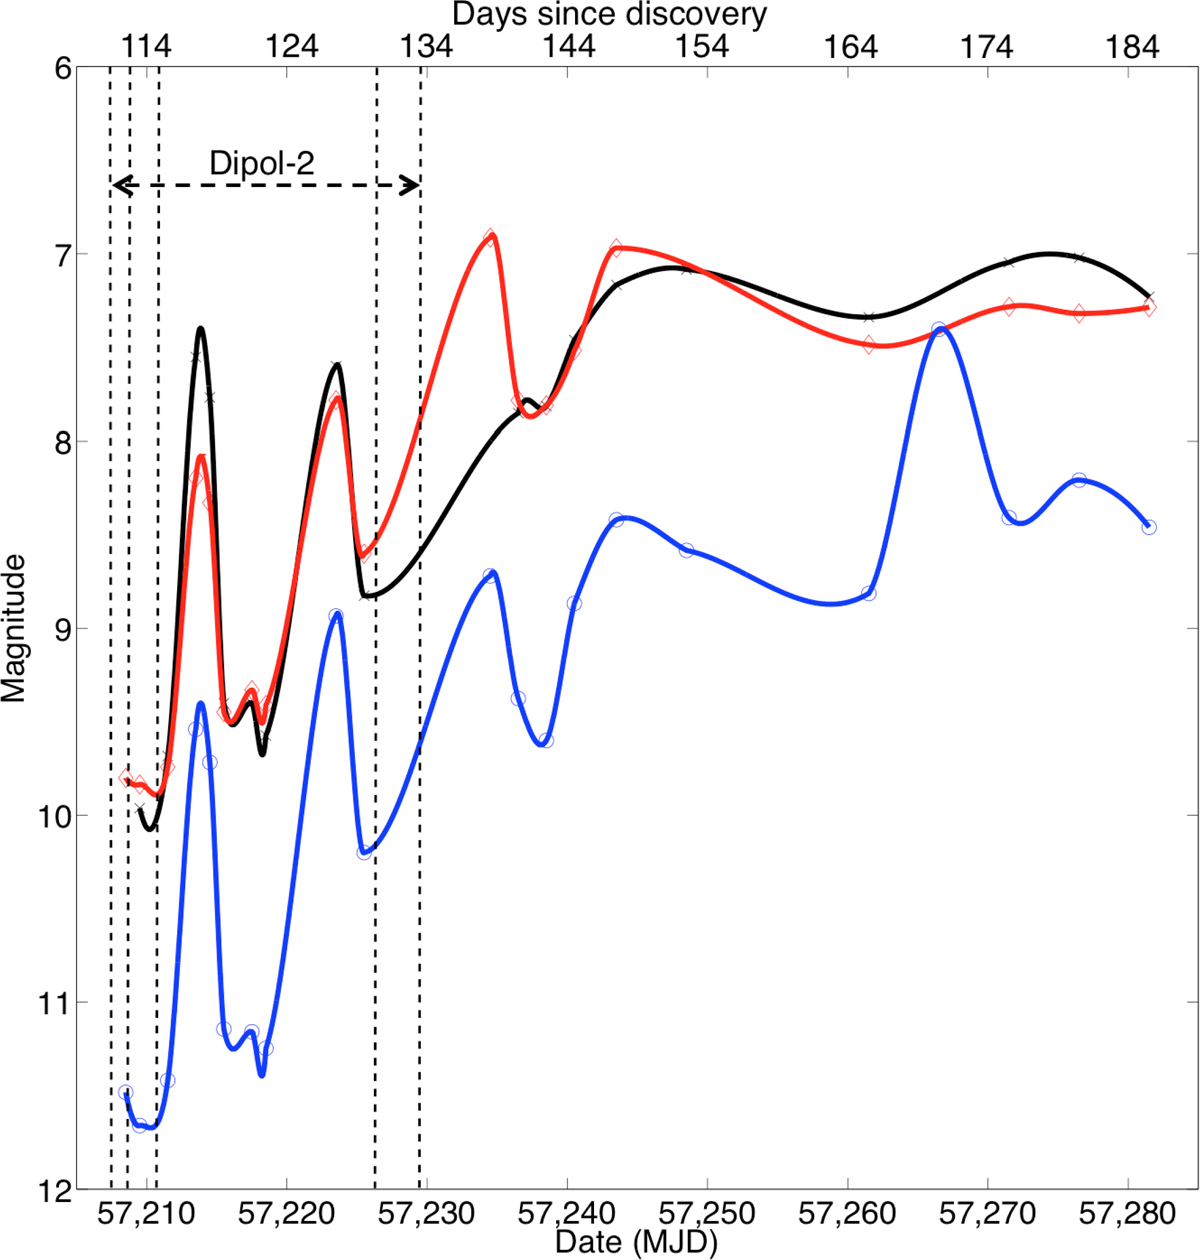
Results of differential photometry from the RINGO3 polarimetric data. The cusps on the rise out of the nova’s dust-dip areclearly visible in the plot. The first cusp corresponds to the grain destruction seen in the Dipol-2 data days 111–114 post-discovery. The rise on the third cusp feature visible in the plot is from the grain growth period suggested by the Dipol-2 observations, these observations lie between the dashed lines on the plot. The lines are colour-matched with the RINGO3 bands, blue is blue, red is red and green is black.
Current usage metrics show cumulative count of Article Views (full-text article views including HTML views, PDF and ePub downloads, according to the available data) and Abstracts Views on Vision4Press platform.
Data correspond to usage on the plateform after 2015. The current usage metrics is available 48-96 hours after online publication and is updated daily on week days.
Initial download of the metrics may take a while.