Fig. 2
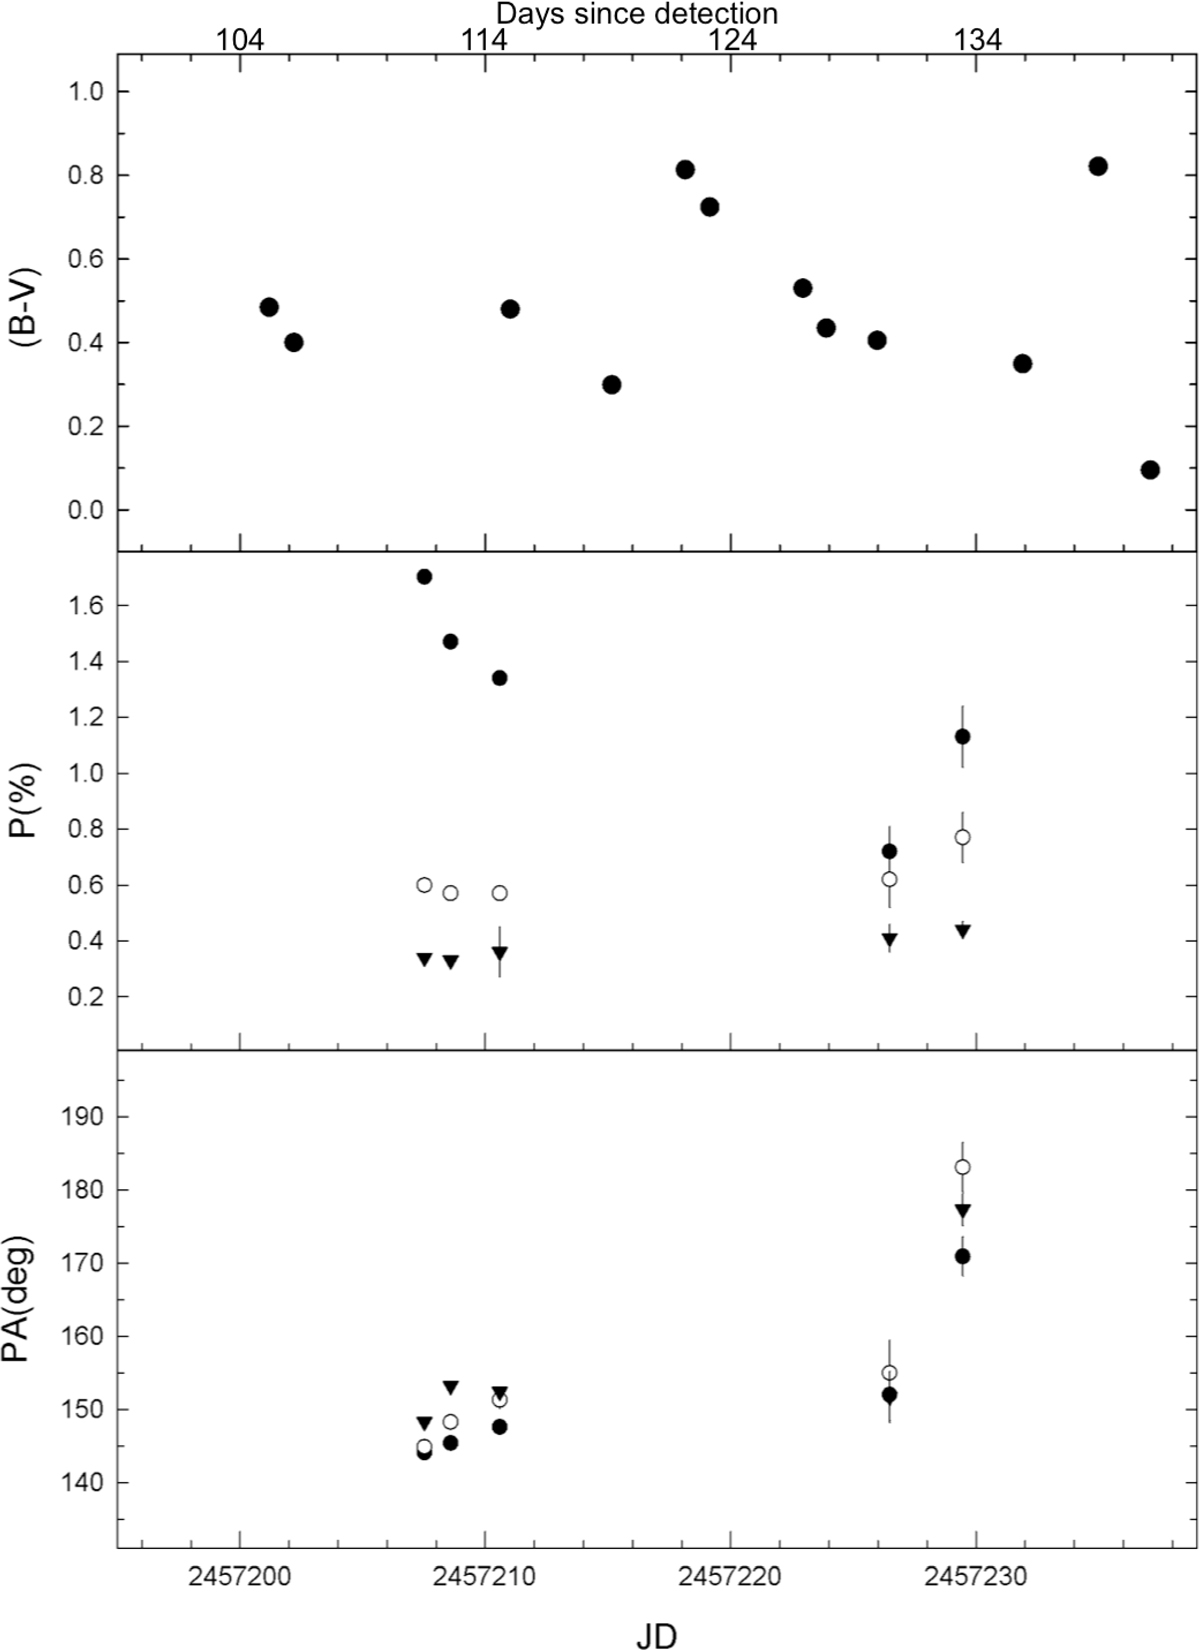
Panels from top to bottom: (B − V) colour index as derived from AAVSO data during Dipol-2 observation epoch; the middle panel shows the measured absolute polarisation degree in percentage and the bottom panel shows the recorded position angles for the polarisation measurements. The filled circles shows the data for the B-band, hollow circles – V -band and filled triangles – R-band. Days since outburst are marked along the top x-axis. The error bars (±1σ) are smaller than the plotting symbol for the WHT data (days 111–114 post outburst).
Current usage metrics show cumulative count of Article Views (full-text article views including HTML views, PDF and ePub downloads, according to the available data) and Abstracts Views on Vision4Press platform.
Data correspond to usage on the plateform after 2015. The current usage metrics is available 48-96 hours after online publication and is updated daily on week days.
Initial download of the metrics may take a while.