Fig. 1
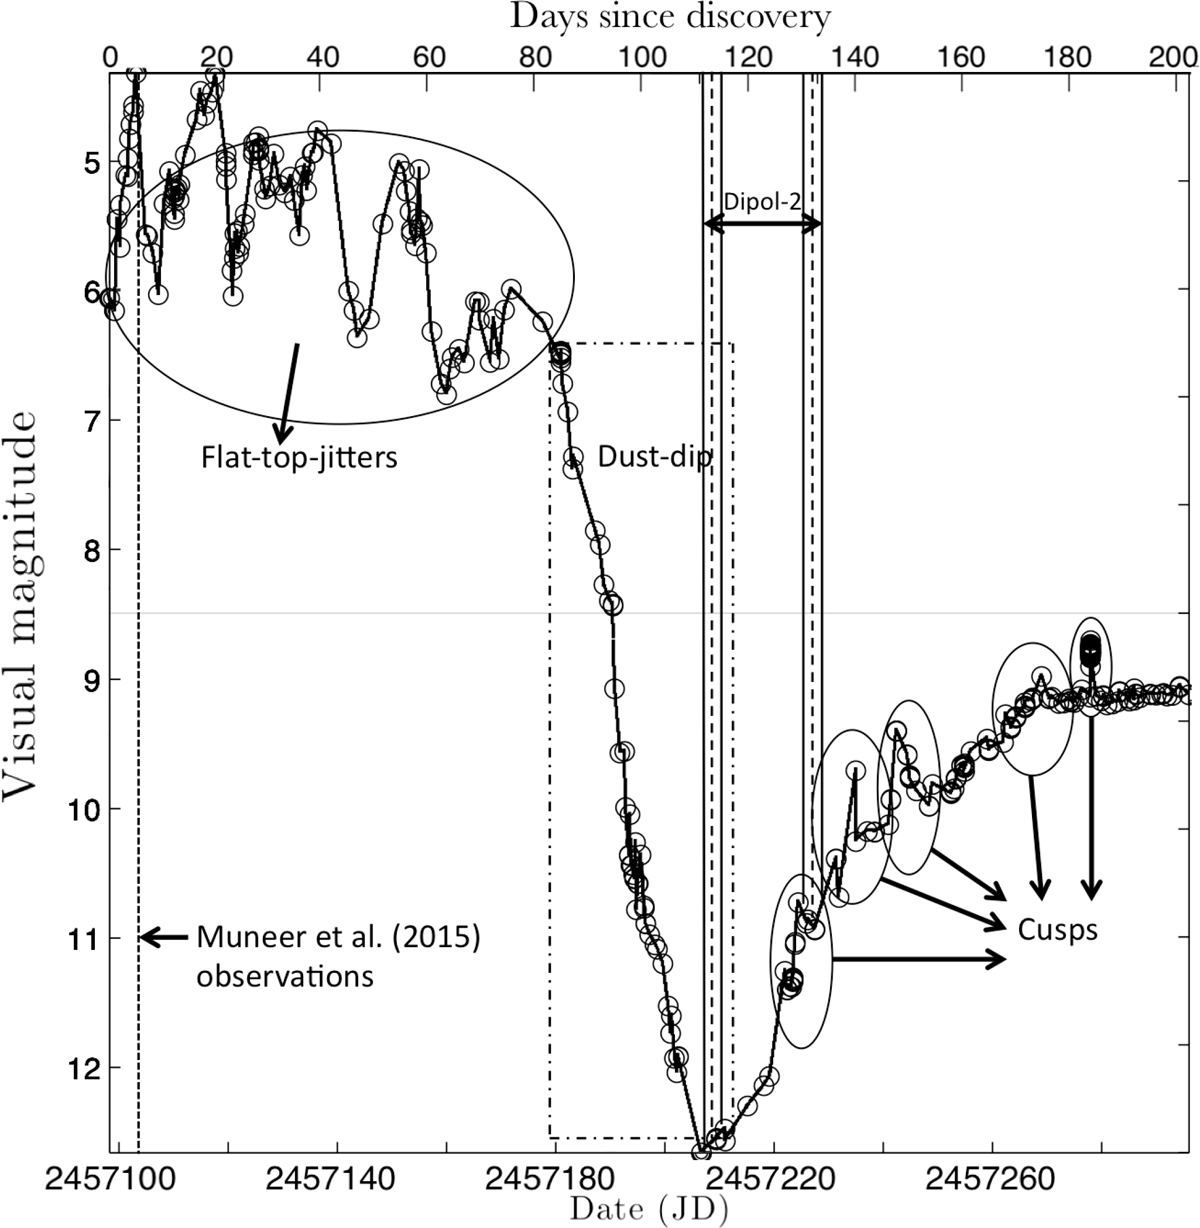
V5668 Sgr AAVSO light curve. Marked are the three major light curve stages observable in the figure, i.e. the flat-top-jitters, the deep dust-dip and the cusp shaped features seen on the rise out of the dust-dip. Marked are the times of polarimetric observations of the nova by both the Muneer et al. (2015) team and those presented in this paper, i.e. the Dipol-2 measurements. The y-axis demonstrates the change in visual magnitude whereas the x-axis contains theJulian date on the bottom and days since discovery on the top.
Current usage metrics show cumulative count of Article Views (full-text article views including HTML views, PDF and ePub downloads, according to the available data) and Abstracts Views on Vision4Press platform.
Data correspond to usage on the plateform after 2015. The current usage metrics is available 48-96 hours after online publication and is updated daily on week days.
Initial download of the metrics may take a while.