Fig. 8
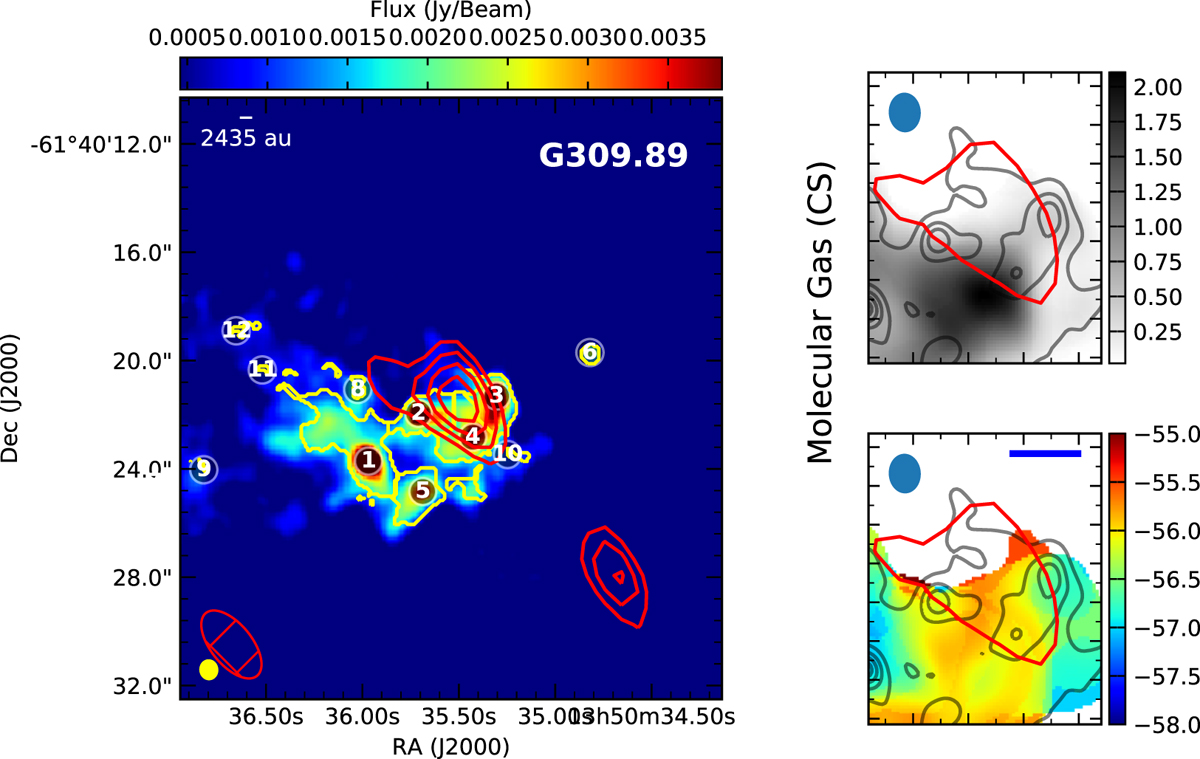
Continuum and CS emission from G309.89. Left panel: 256 GHz continuum in colour scale with 5 GHz emission in red contours. The yellow contours show the outlines of the FellWalker identified cores. Two right panels: moment 0 and moment 1 (top and bottom, respectively) maps of the CS emission focussed on the brightest clump, where the HII region is expected to be (although no H29α was detected, the 5 GHz continuum shows its location).
Current usage metrics show cumulative count of Article Views (full-text article views including HTML views, PDF and ePub downloads, according to the available data) and Abstracts Views on Vision4Press platform.
Data correspond to usage on the plateform after 2015. The current usage metrics is available 48-96 hours after online publication and is updated daily on week days.
Initial download of the metrics may take a while.