Fig. B.2
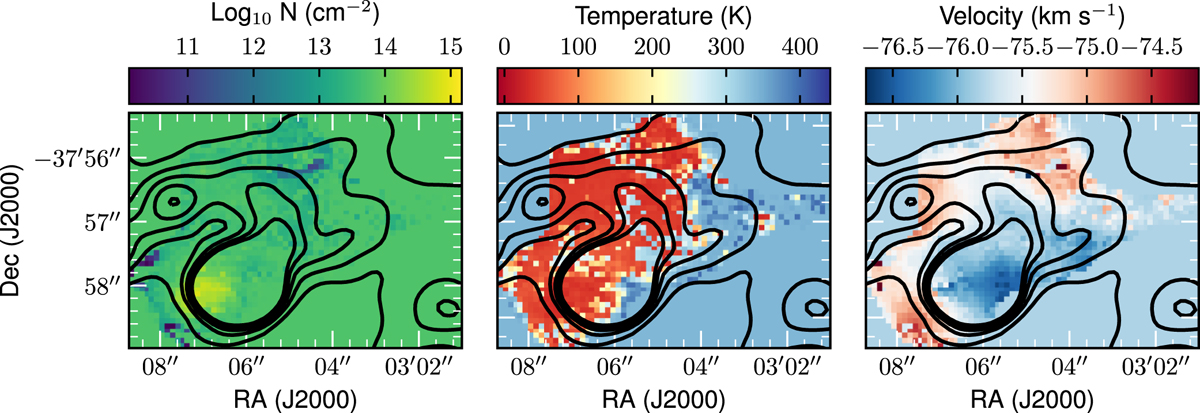
Physical properties (e.g. column density, temperature, and velocity structure from left to right) of the CH3 CCH emission derived through XCLASS fitting of the five spectral components shown in Fig. B.1 for G336.98. The sharp edge in the temperature and velocity maps indicates the edge of the fitting area rather than a physical jump in parameters.
Current usage metrics show cumulative count of Article Views (full-text article views including HTML views, PDF and ePub downloads, according to the available data) and Abstracts Views on Vision4Press platform.
Data correspond to usage on the plateform after 2015. The current usage metrics is available 48-96 hours after online publication and is updated daily on week days.
Initial download of the metrics may take a while.