Fig. B.1
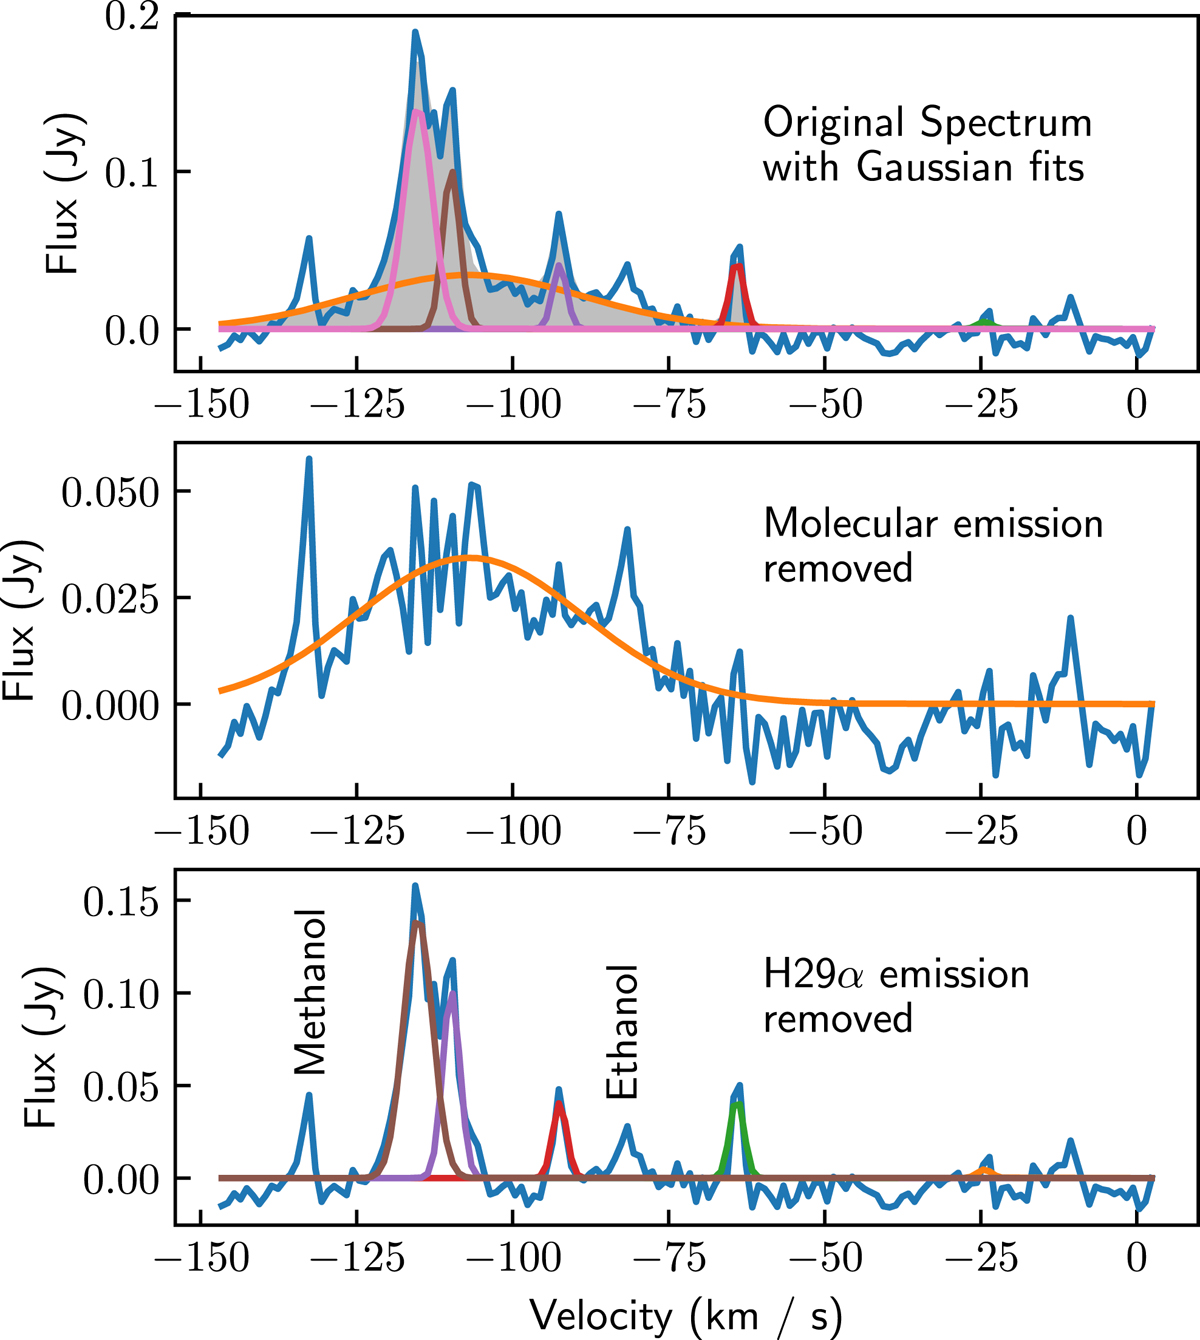
H29α and CH3 CCH Gaussian fits to the emission from G336.98. The blue curve shows the overall emission spectrum, the orange curve shows the Gaussian fit to H29α, and the other colour curves show the Gaussian fits to the CH3CCH components. In the top panel, the blue curve shows the original spectrum; the grey fill indicates the sum of the Gaussian components at each velocity. In the middle panel, the molecular Gaussian components have been removed, and in the bottom panel, the H29α has been removed, showing how well the individual Gaussian components fit the spectrum. The additional, unfit lines correspond to other species such as methanol and ethanol (at ~–130 and ~–80 km s−1 , respectively), which were not included in the XCLASS fit.
Current usage metrics show cumulative count of Article Views (full-text article views including HTML views, PDF and ePub downloads, according to the available data) and Abstracts Views on Vision4Press platform.
Data correspond to usage on the plateform after 2015. The current usage metrics is available 48-96 hours after online publication and is updated daily on week days.
Initial download of the metrics may take a while.