Fig. A.3
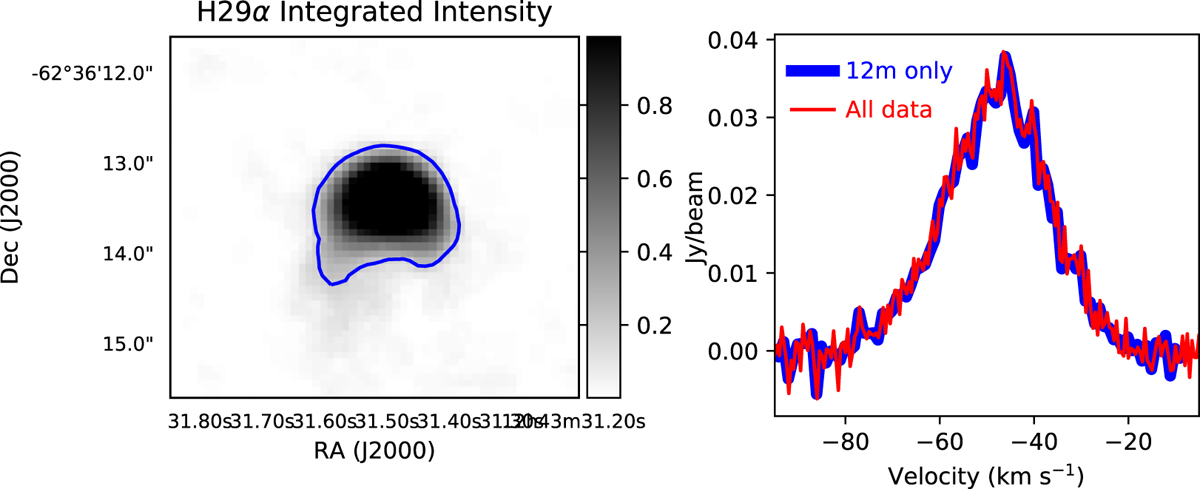
H29α Data combination: Comparison between 12 m only and full dataset for capturing the H29α flux. Left: integrated intensity of H29α towards G302.02, where the blue contour shows the 10% power contour of the emission. The map was created with a 3σ clipping mask and the greyscale is limited to 50% power to highlight the low-lying emission. Right: H29α spectra integrated within the 10% contour shown on the left. The blue (thick) line shows the 12 m only data, while the red (thin) line shows the combination of 12 m and ACA data. The lack of significant differences between the spectra suggests that the ACA is not required to capture all of the flux from the RRLs.
Current usage metrics show cumulative count of Article Views (full-text article views including HTML views, PDF and ePub downloads, according to the available data) and Abstracts Views on Vision4Press platform.
Data correspond to usage on the plateform after 2015. The current usage metrics is available 48-96 hours after online publication and is updated daily on week days.
Initial download of the metrics may take a while.