Free Access
Fig. A.2
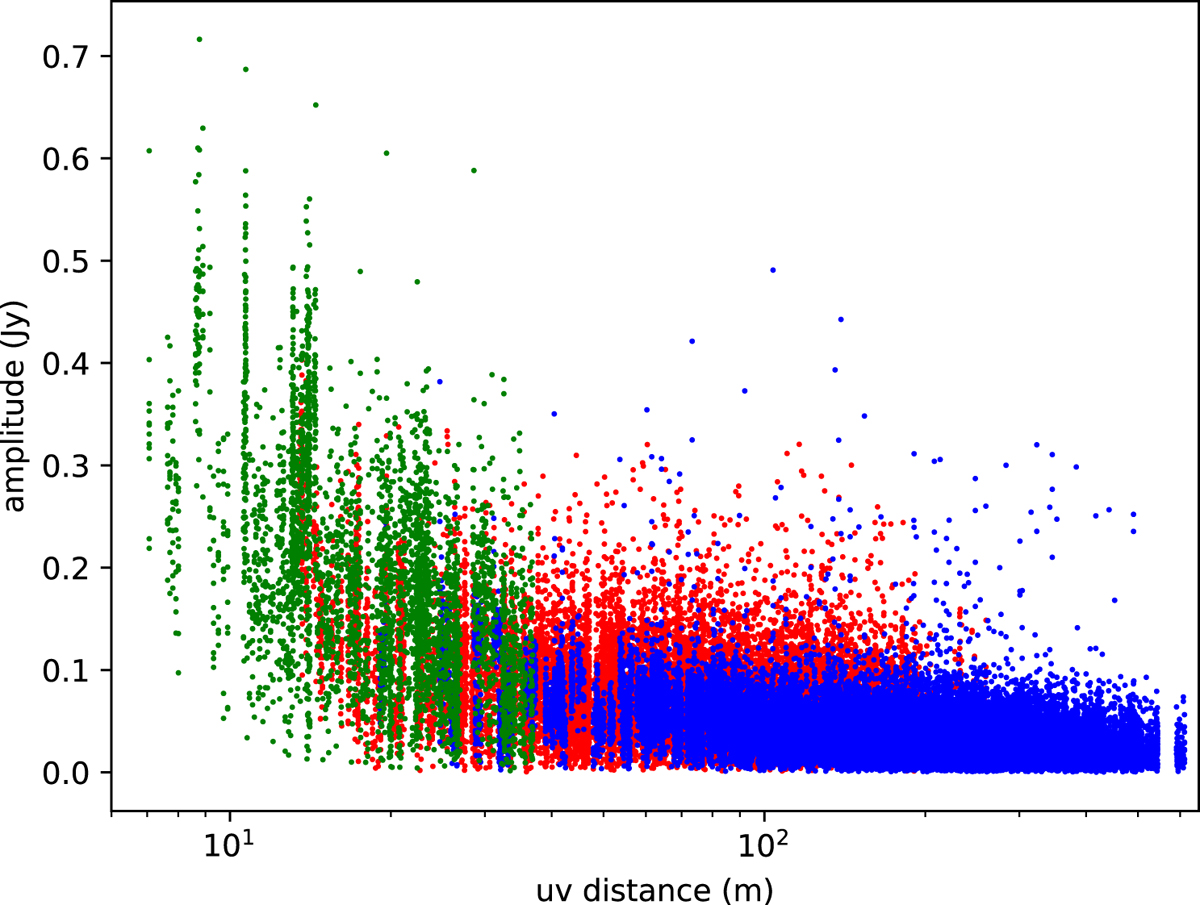
Continuum emission in the three configurations: ACA (green), compact 12 m (red), and extended 12 m (blue). The amplitudes are generally consistent with each other, given the rms noise limits in each map, and show the same trends with uv distance (e.g. higher amplitudes at lower spatial frequencies – larger size scales).
Current usage metrics show cumulative count of Article Views (full-text article views including HTML views, PDF and ePub downloads, according to the available data) and Abstracts Views on Vision4Press platform.
Data correspond to usage on the plateform after 2015. The current usage metrics is available 48-96 hours after online publication and is updated daily on week days.
Initial download of the metrics may take a while.