Fig. A.1
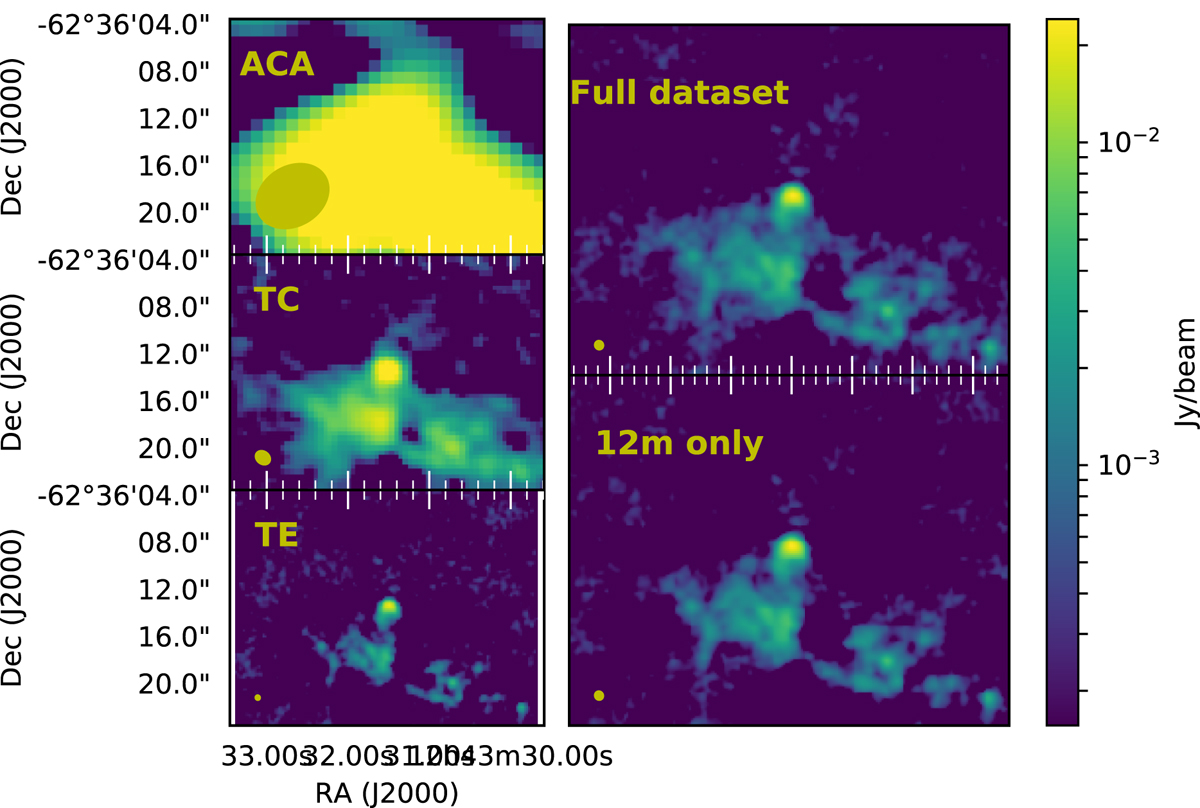
Continuum data combination for G302.02: Left three panels: data obtained with each individual antenna configuration; the two 12 m configurations are labelled as TC and TE for the compact and extended configurations, respectively.Right panels: combined datasets. Bottom right panel: 12 m data only, while top right panel: full continuum dataset. The integrated fluxes of the two right panels vary by 20%, although their peak fluxes are relatively consistent with each other. The scaling is the same for all five plots, as shown at the right.
Current usage metrics show cumulative count of Article Views (full-text article views including HTML views, PDF and ePub downloads, according to the available data) and Abstracts Views on Vision4Press platform.
Data correspond to usage on the plateform after 2015. The current usage metrics is available 48-96 hours after online publication and is updated daily on week days.
Initial download of the metrics may take a while.