Fig. 1
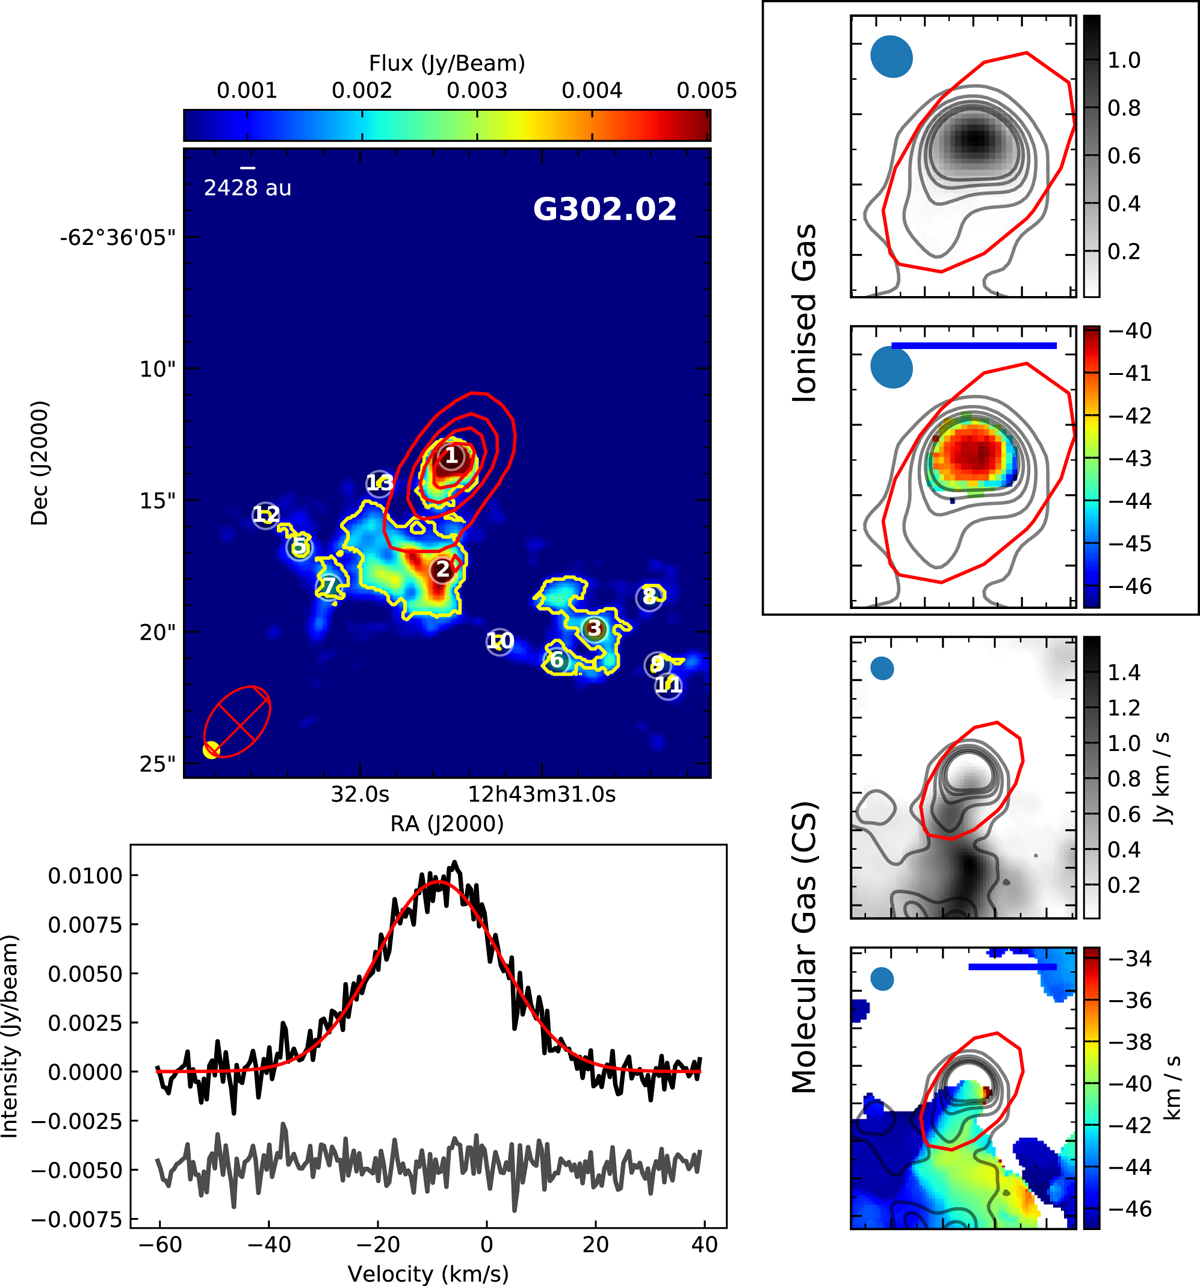
Continuum, H29α, and CS emission from G302.02. Top left panel: 256 GHz continuum in colour scale in which the 5 GHz emission is shown in red contours; the red contours in the other images represent this same 5 GHz emission for comparison. The yellow contours show the outlines of the FellWalker identified cores. Bottom left panel: H29α emission (black) with its Gaussian fit. The grey line shows the residuals from the Gaussian fit. In these spectra, the emission has been recentred to the expected rest velocity of the source, thus the velocity shift of the line peak (from zero) represents a difference between the ionised and molecular gas velocities. Top two panels on the right: moment 0 and moment 1 maps of the H29α emission (top and bottom), while bottom two panels on the right: moment 0 and moment 1 maps of the CS emission (top and bottom).
Current usage metrics show cumulative count of Article Views (full-text article views including HTML views, PDF and ePub downloads, according to the available data) and Abstracts Views on Vision4Press platform.
Data correspond to usage on the plateform after 2015. The current usage metrics is available 48-96 hours after online publication and is updated daily on week days.
Initial download of the metrics may take a while.