Fig. A.1
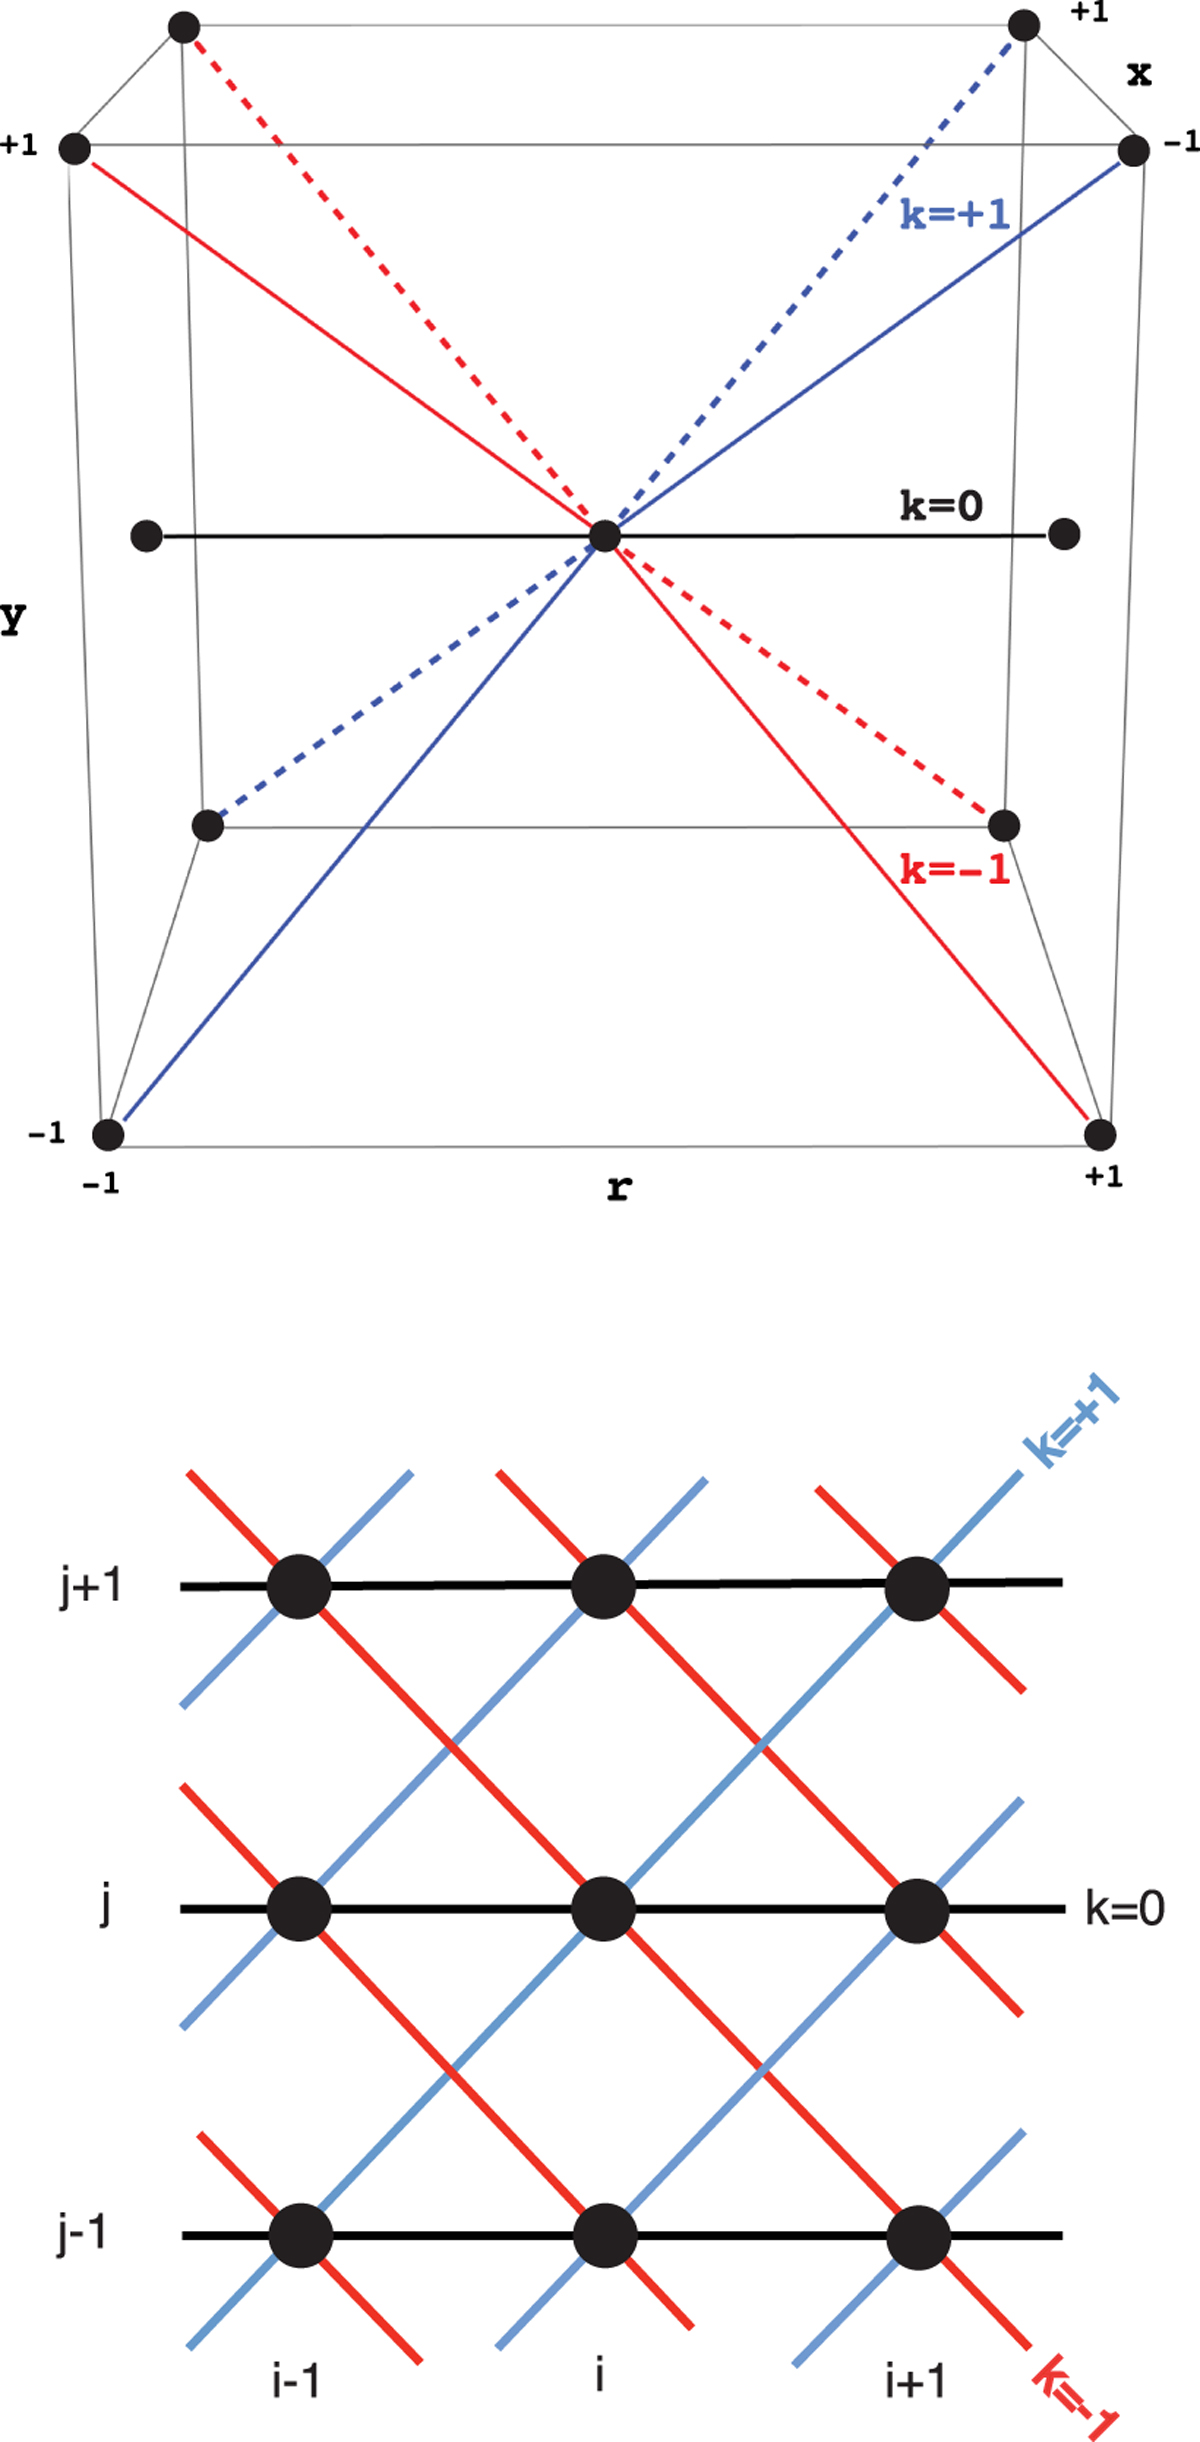
Ray trajectories in the prograde (k = +1; blue), radial (k = 0; black), and retrograde (k = −1; red) directions, crossing grid nodes (black dots) that neighbor a central node with spatial indices {i, j}. The upper panel shows the full 3D geometry of the radiation rays. Since conditions are assumed constant in x (and thus symmetric about x = 0), ray integrations computed along dashed and solid lines of the same color are identical, and so can be accounted for by simply doing one prograde (blue) and one retrograde (red) integration, and then giving these double weight in the angle quadrature. The lower panel shows thesefinal three distinct rays projected on the 2D r − y calculation plane.
Current usage metrics show cumulative count of Article Views (full-text article views including HTML views, PDF and ePub downloads, according to the available data) and Abstracts Views on Vision4Press platform.
Data correspond to usage on the plateform after 2015. The current usage metrics is available 48-96 hours after online publication and is updated daily on week days.
Initial download of the metrics may take a while.