Fig. 7
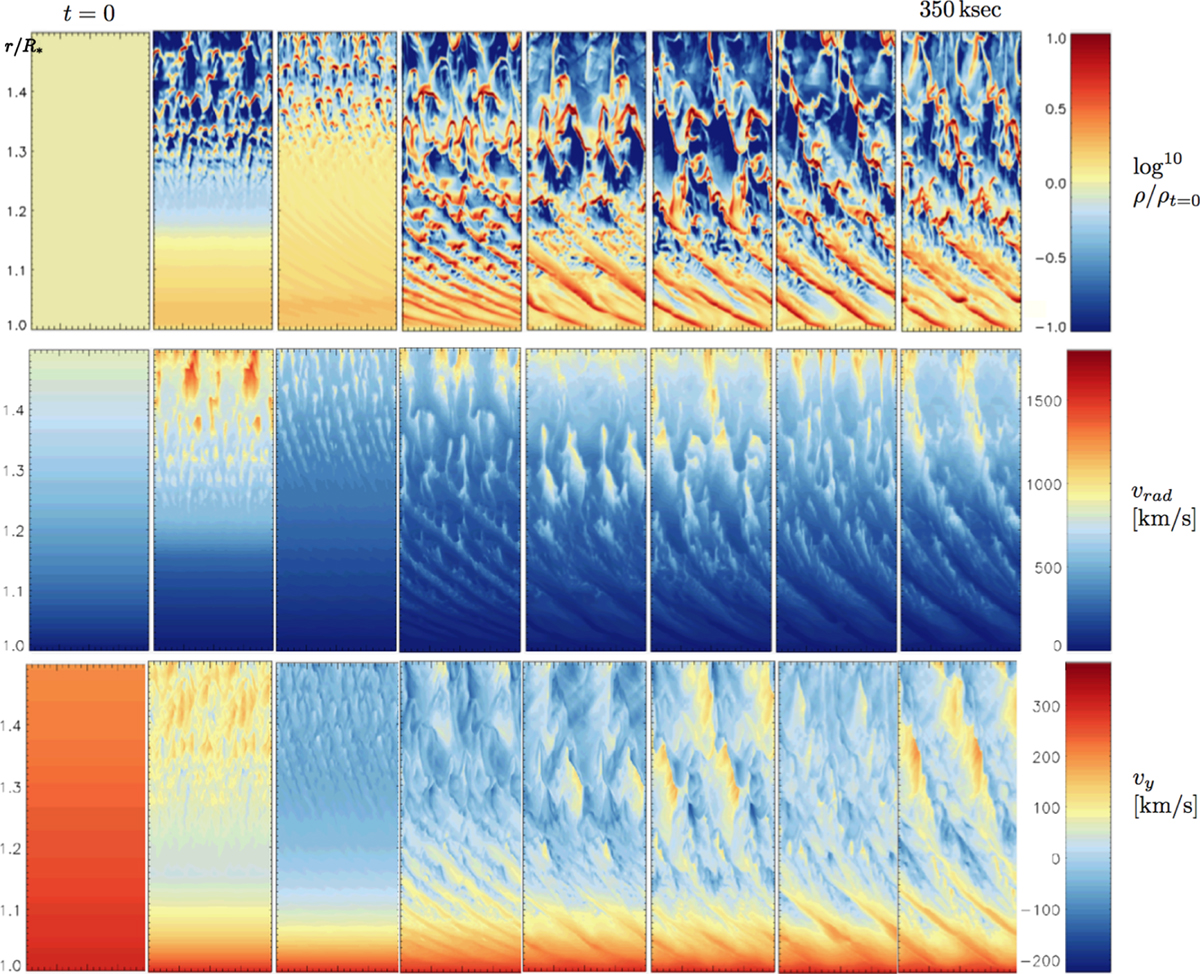
Spatial and temporal variations of log density, radial velocity, and lateral velocity for a modelwith stellar rotation at the surface vy = 300 km s−1 (see text), with color-coding as in Figs. 2 and 4. The vertical variation in this simulation extends only from 1.0 to 1.5 R* , but the lateral variation is displayed as before over twice the horizontal box length 0.1R* . From left to right are shown the time evolution over 350 ks after the CAK initial condition, in steps of 50 ks.
Current usage metrics show cumulative count of Article Views (full-text article views including HTML views, PDF and ePub downloads, according to the available data) and Abstracts Views on Vision4Press platform.
Data correspond to usage on the plateform after 2015. The current usage metrics is available 48-96 hours after online publication and is updated daily on week days.
Initial download of the metrics may take a while.