Free Access
Fig. 5
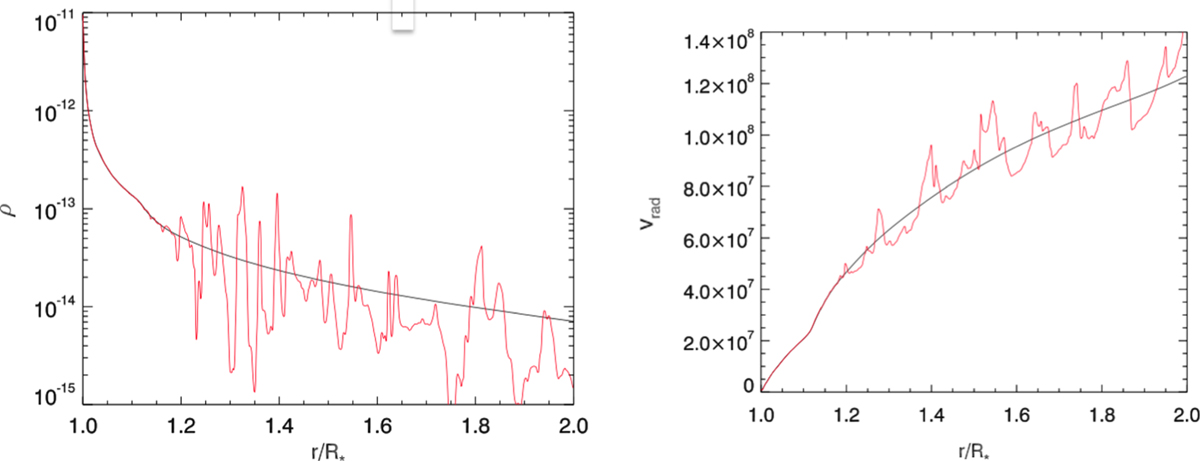
Radial cuts through the 2D simulation box of density ρ [g cm−3 ] (left) and radial velocity vrad [cm s−1] (right). Thered curves are taken at a snapshot long after the simulation has developed into a statistically quite steady flow; the black curves compare this to average values.
Current usage metrics show cumulative count of Article Views (full-text article views including HTML views, PDF and ePub downloads, according to the available data) and Abstracts Views on Vision4Press platform.
Data correspond to usage on the plateform after 2015. The current usage metrics is available 48-96 hours after online publication and is updated daily on week days.
Initial download of the metrics may take a while.