Fig. 3
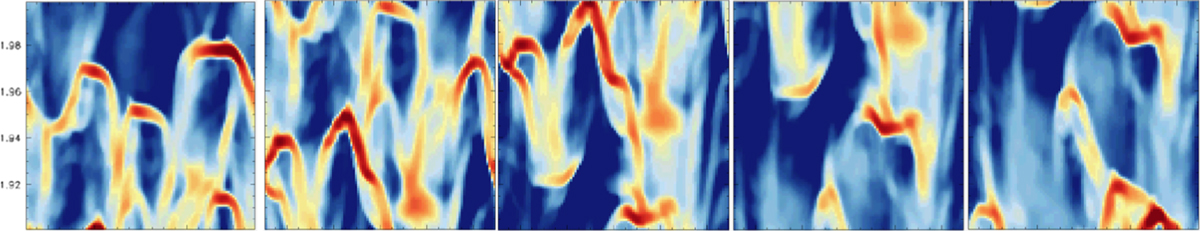
As in Fig. 2, spatial and temporal variations of log density relative to the initial, smooth CAK steady state at t = 0 are shown, with color ranging from densities a decade below the t = 0 value (blue) to a decade above (red). Here the vertical variation only extends between 1.9R* and 2.0R* and the lateral variation is displayed over one horizontal box of 0.1R* ; there are thus 100 × 100 discrete mesh points in each of the displayed squares. From left to right are shown a 2 ks time evolution long after the initial condition, in steps of 0.5 ks.
Current usage metrics show cumulative count of Article Views (full-text article views including HTML views, PDF and ePub downloads, according to the available data) and Abstracts Views on Vision4Press platform.
Data correspond to usage on the plateform after 2015. The current usage metrics is available 48-96 hours after online publication and is updated daily on week days.
Initial download of the metrics may take a while.