Fig. 2
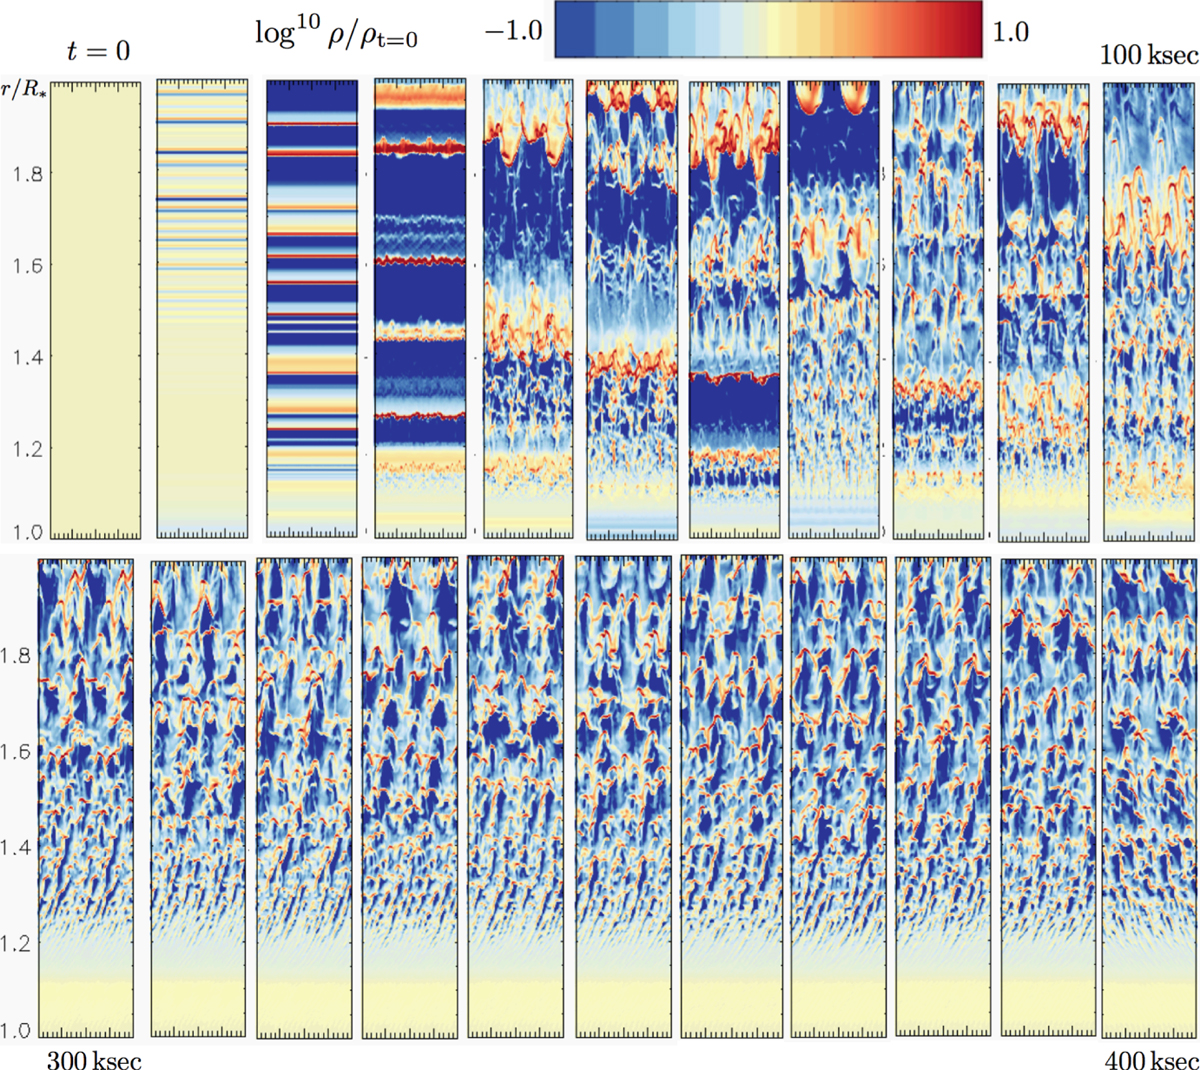
Spatial and temporal variations of log density relative tothe initial, smooth CAK steady state at t = 0, with color ranging from densities a decade below the t = 0 value (blue) to a decade above (red). The vertical variation extends from the subsonic wind base at the stellar surface R* to a height of one R* above. For clarity, the lateral variation is displayed over twice the horizontal box length 0.1R* . The upper row shows time evolution over the initial 100 ks after the CAK initial condition in steps of 10 ks; the bottom row uses the same step size of 10 ks to show the evolution between 300 and 400 ks, long after the initial condition has developed into a statistically steady turbulent flow.
Current usage metrics show cumulative count of Article Views (full-text article views including HTML views, PDF and ePub downloads, according to the available data) and Abstracts Views on Vision4Press platform.
Data correspond to usage on the plateform after 2015. The current usage metrics is available 48-96 hours after online publication and is updated daily on week days.
Initial download of the metrics may take a while.