Fig. 8
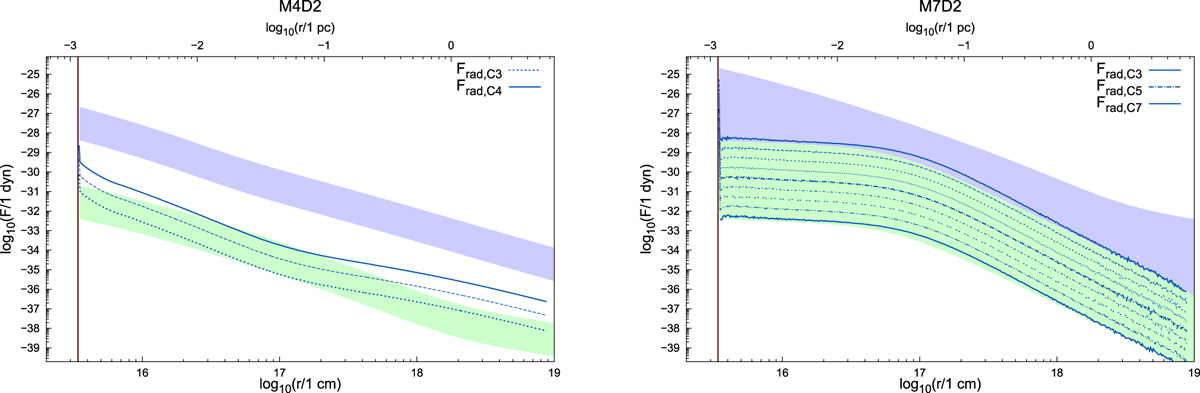
Radial profile of radiative force (blue lines) for different molecular cloud models M4 (left panel) and M7 (right panel)with an outer radius of Rout = 5 pc and a constant dust temperature of Td = 20 K simulated with cluster models C3 through C7 in half steps.The blue band represents the same simulations with the absorption and reprocessing of radiation switched off (Cabs = 0 cm2), while the green bands result from the same simulations with an instantaneous redistribution of radiation (Csca = 0 cm2).
Current usage metrics show cumulative count of Article Views (full-text article views including HTML views, PDF and ePub downloads, according to the available data) and Abstracts Views on Vision4Press platform.
Data correspond to usage on the plateform after 2015. The current usage metrics is available 48-96 hours after online publication and is updated daily on week days.
Initial download of the metrics may take a while.