Fig. 4
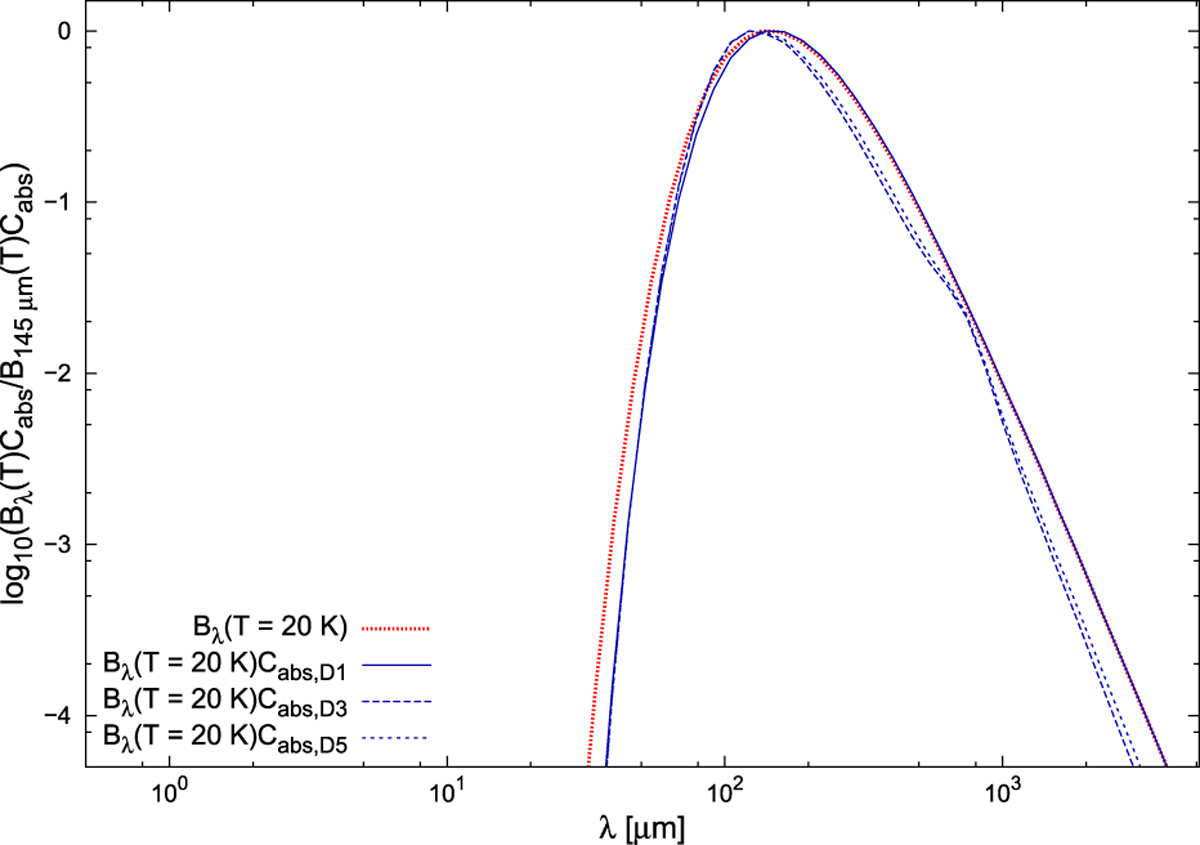
Comparison of modified blackbody spectra for the three different dust models displayed in Fig. 2 for a dust temperature of Td = 20 K and upper values of amax of 0.02 μm (D1 ), 2 μm (D3 ), and 200 μm (D5 ), respectively.These spectra are more narrowly peaked and skewed toward smaller wavelengths than the corresponding Planck function Bλ(Td), because the emission is weighted by the absorption cross section, Cabs,λ, which drops significantly at sub-mm and mm wavelengths.
Current usage metrics show cumulative count of Article Views (full-text article views including HTML views, PDF and ePub downloads, according to the available data) and Abstracts Views on Vision4Press platform.
Data correspond to usage on the plateform after 2015. The current usage metrics is available 48-96 hours after online publication and is updated daily on week days.
Initial download of the metrics may take a while.