Fig. 2
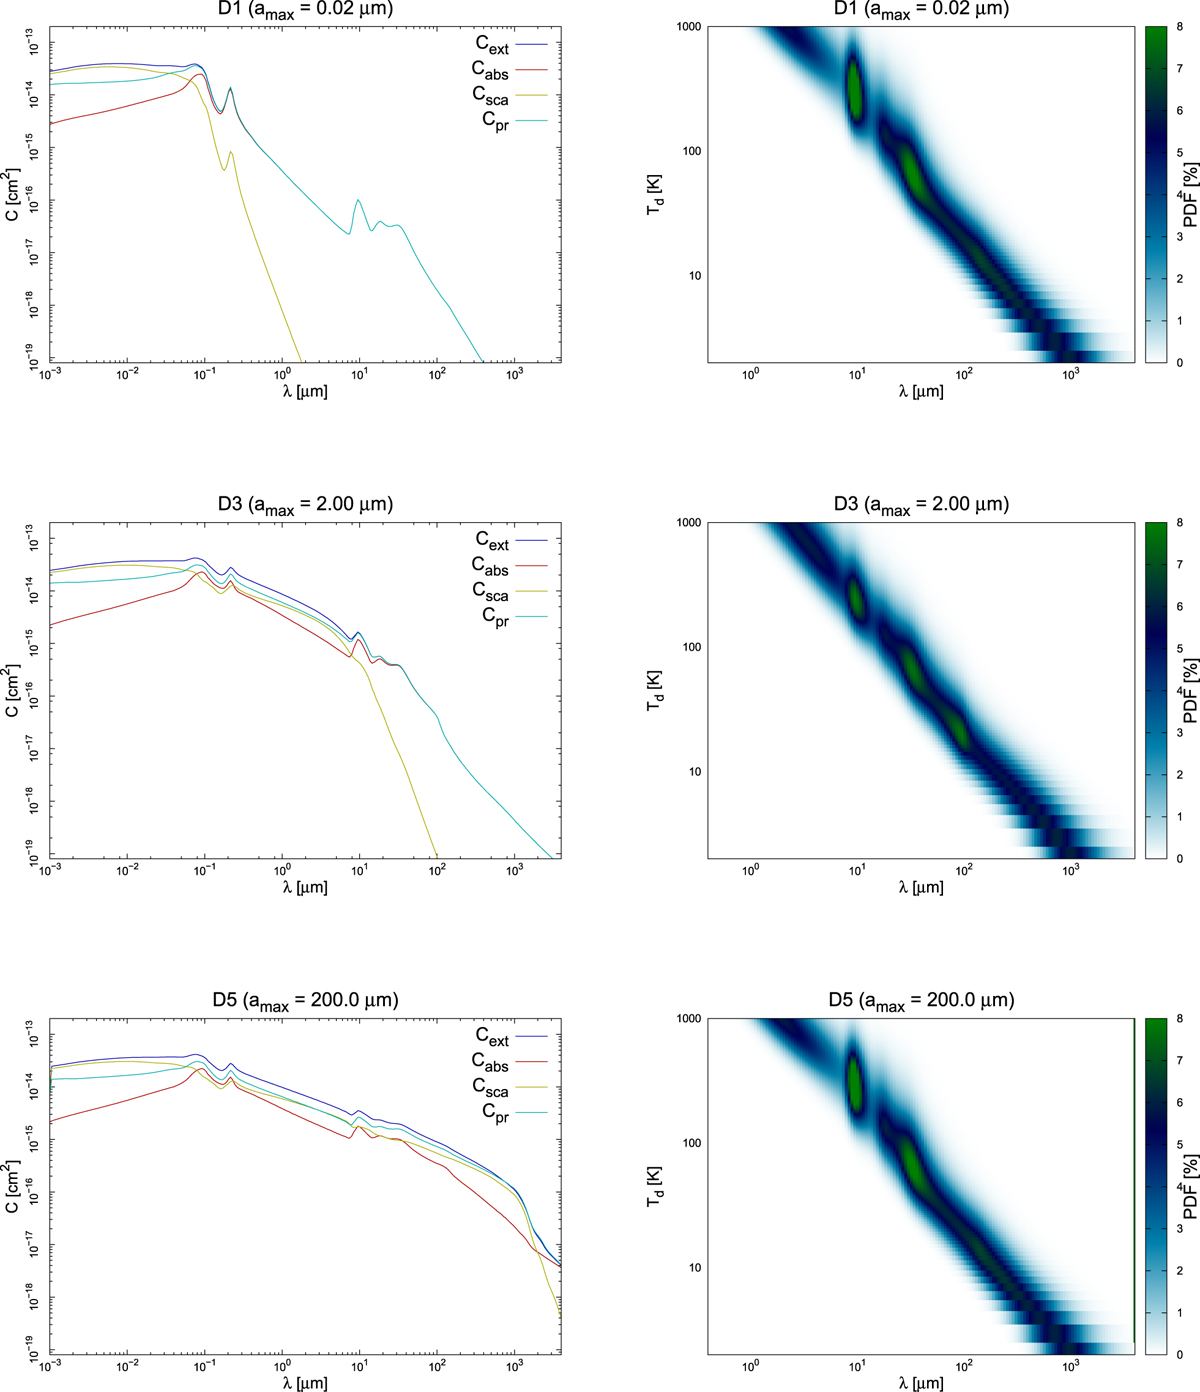
Left panels: size averaged cross section of extinction Cext, scattering Csca, absorption Cabs, and pressure Cpr over wavelength. Right panels: probability distribution of re-emitted wavelength for different dust temperatures. Different rows are for distinct maximum grain radii corresponding to the dust grain models D1 (top row), D3 (middle row), and D5 (bottom row).
Current usage metrics show cumulative count of Article Views (full-text article views including HTML views, PDF and ePub downloads, according to the available data) and Abstracts Views on Vision4Press platform.
Data correspond to usage on the plateform after 2015. The current usage metrics is available 48-96 hours after online publication and is updated daily on week days.
Initial download of the metrics may take a while.