Fig. 12
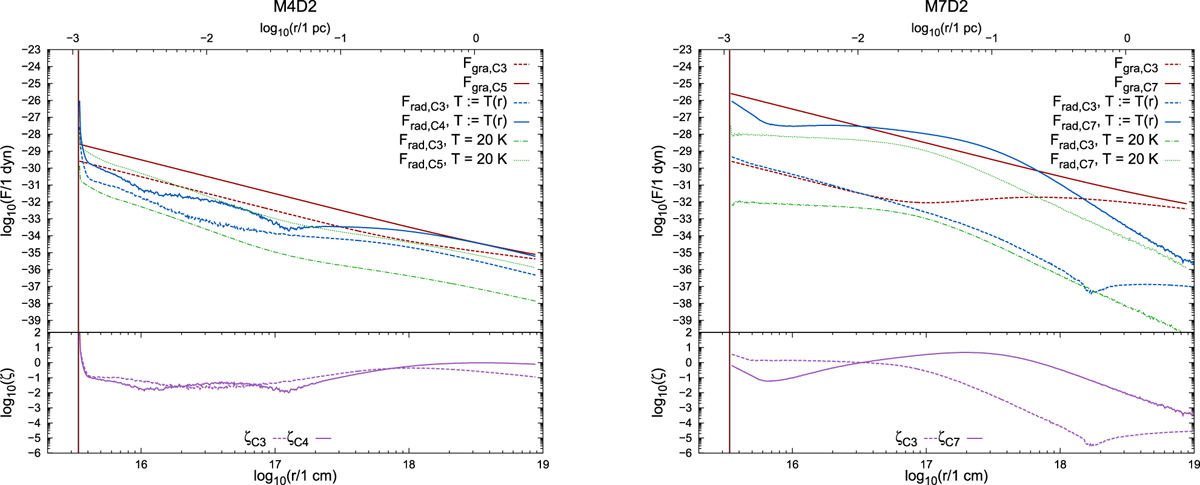
Comparison of radiative and gravitational forces in models with self-consistent (blue lines) and constant (green lines) dust temperature. Cloud models are M4 (left) and M7 (right), and radiative forces were calculated for cluster models C3, C5 , and C7 and the D2 dust model. The radial dust temperature distributions follow the temperatures shown in Fig. 10. The ratio ζ is shown below (purple) for the variable dust temperature models.
Current usage metrics show cumulative count of Article Views (full-text article views including HTML views, PDF and ePub downloads, according to the available data) and Abstracts Views on Vision4Press platform.
Data correspond to usage on the plateform after 2015. The current usage metrics is available 48-96 hours after online publication and is updated daily on week days.
Initial download of the metrics may take a while.