Fig. 2
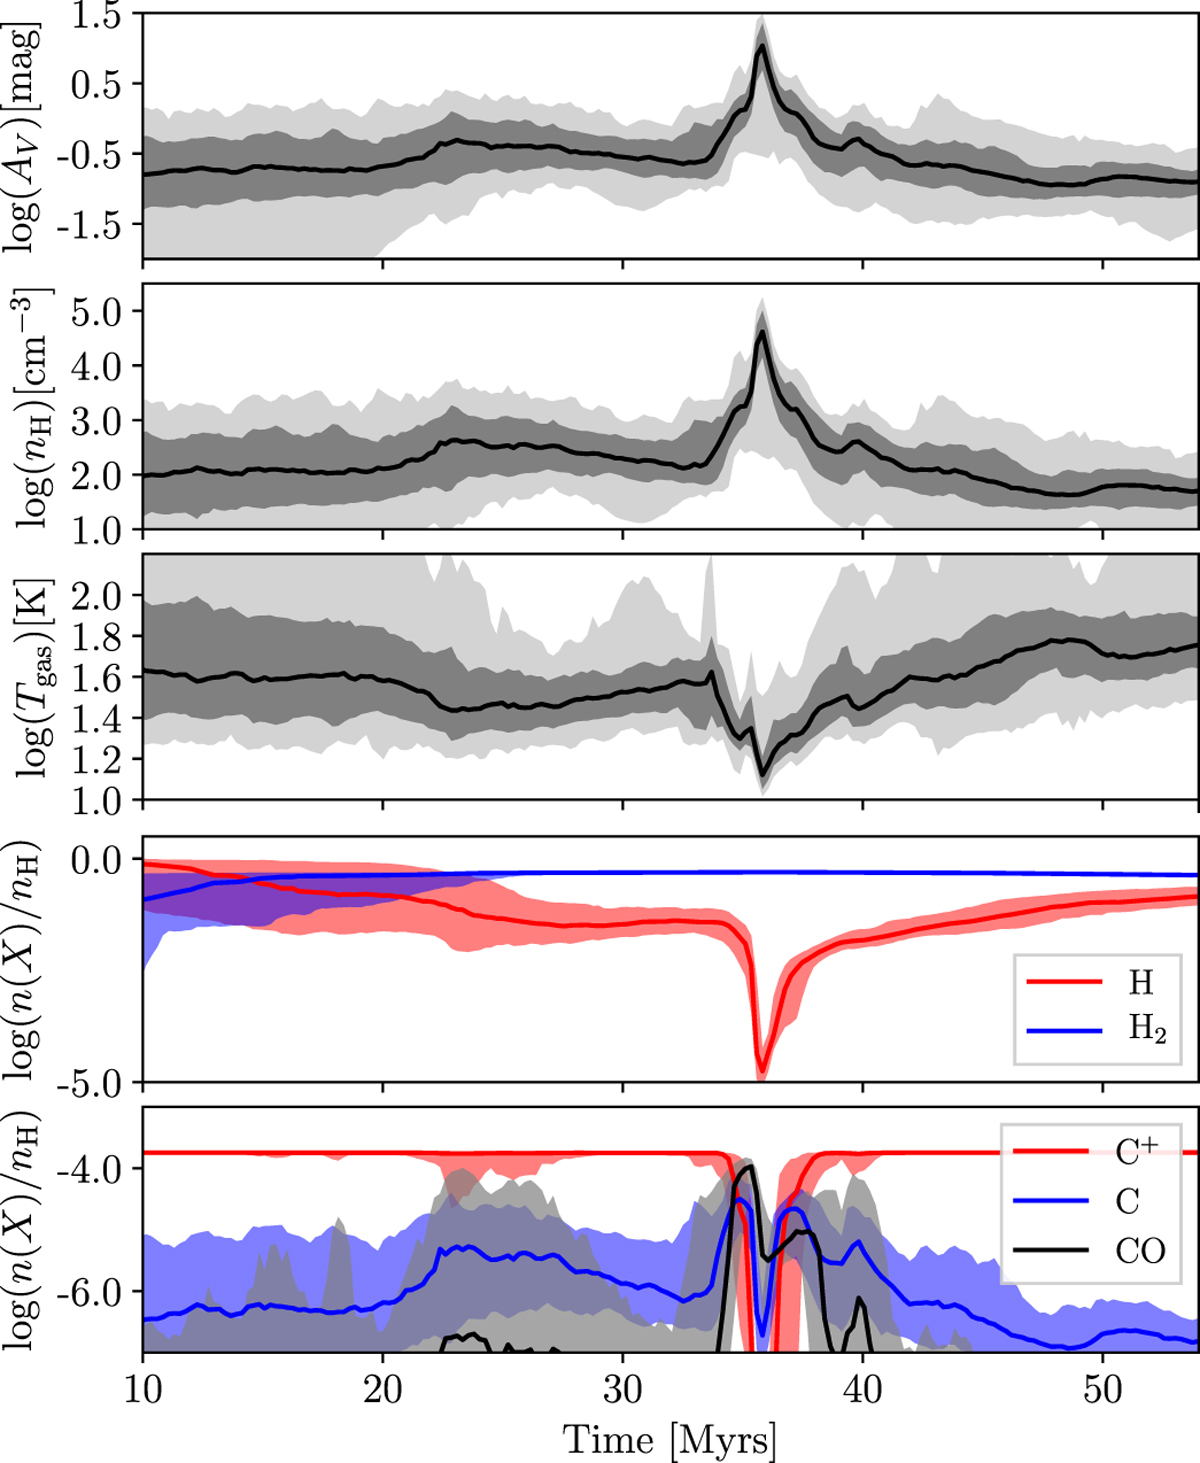
Statistics associated with the evolution of the physical parameters of all SPH particles that compose cloud A. For the three first plots, the black line shows the evolution of the median of the physical parameters. The dark gray filled area shows the 16th and 84th percentiles and the light gray filled area indicates the 2nd and 98th percentiles of the distribution. For the last two plots, the lines show the evolution of the median of the abundances while the filled area shows the 16th and 84th percentiles of the distribution.
Current usage metrics show cumulative count of Article Views (full-text article views including HTML views, PDF and ePub downloads, according to the available data) and Abstracts Views on Vision4Press platform.
Data correspond to usage on the plateform after 2015. The current usage metrics is available 48-96 hours after online publication and is updated daily on week days.
Initial download of the metrics may take a while.