Fig. 12
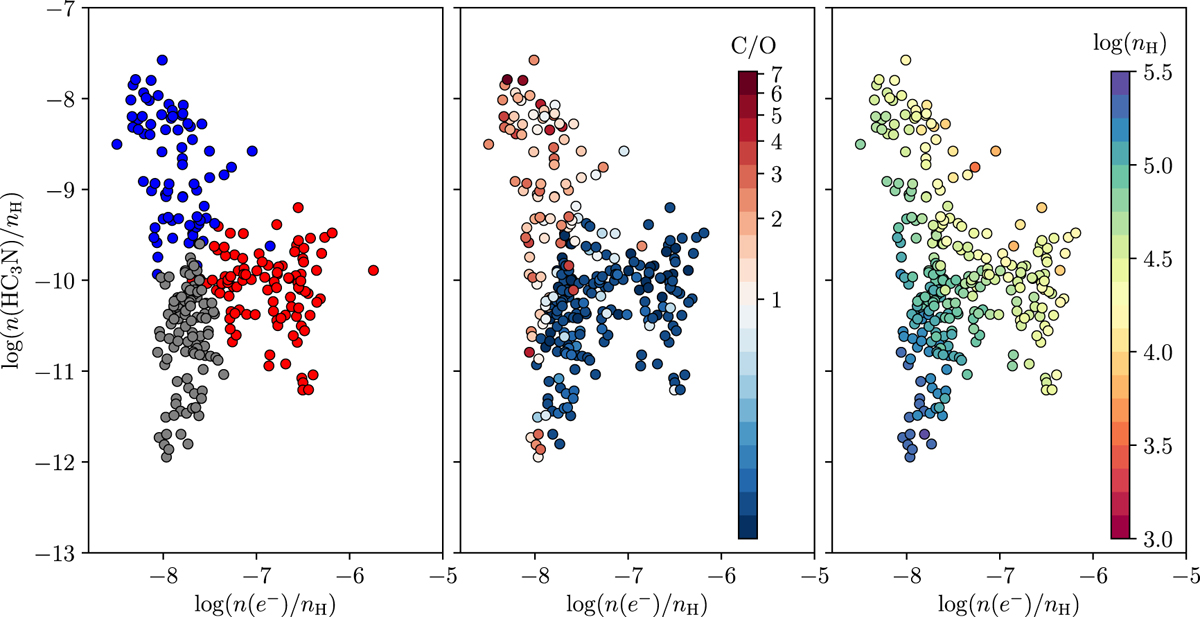
Computed abundances of HC3 N at t = 45.96 Myr as a function of the local electronic fraction of each SPH particle at the peak density of cloud B. The left panel shows the results of the k-mean clustering using k = 3 (the colors show the three identified clusters). This clustering was carried out on the PCs computed from the PCA analysis. The middle panel shows the same results but with a color coding that traces the C/O ratio computed just after the first density phase (i.e., at t ≈ 44.5 Myr) and the right panel with a color coding that traces the individual density of each SPH particle. From these plots, we find that the cluster in blue mostly traces all the particles with a high abundance of HC3 N, a low electronic fraction on the order of n(e− )∕nH ≈ 10−8, and a C/O ratio larger than 1. The cluster in red mostly traces all the particles with a moderate to low abundance of HC3 N, a high electronic fraction, and C/O ≲ 1. Finally, the cluster in gray traces all the particles with a low abundance of HC3 N, a low electronic fraction, and a high local density (nH ≳ 105 cm−3 ).
Current usage metrics show cumulative count of Article Views (full-text article views including HTML views, PDF and ePub downloads, according to the available data) and Abstracts Views on Vision4Press platform.
Data correspond to usage on the plateform after 2015. The current usage metrics is available 48-96 hours after online publication and is updated daily on week days.
Initial download of the metrics may take a while.