Fig. 6
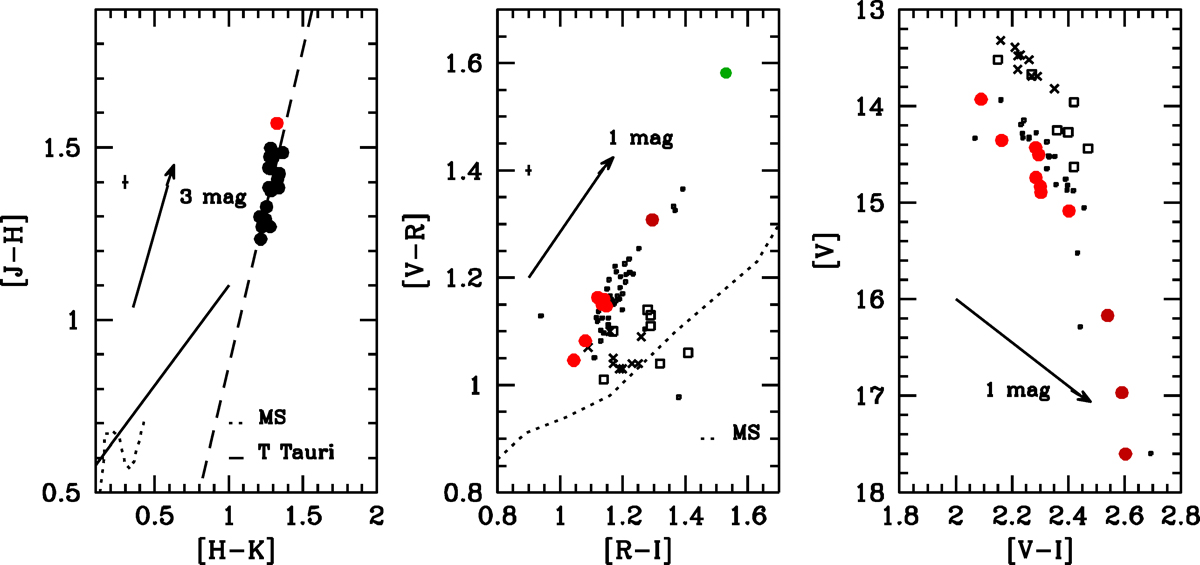
Left panel: NIR two-color plot [J − H] vs. [H − K]. The red point represents the NIR colors at MJD = 57 662 (see text). Continuous line: locus of T Tauri stars (Meyer et al. 1997). Dotted line: unreddened main-sequence. Dashed line: linear fit through the data. Arrow: extinction vector corresponding to AV = 3 mag (reddening law of Cardelli et al. 1989). The average error is indicated with a cross. Middle panel: optical two-color plot [V − R] vs. [R − I]. Arrow: extinction vector corresponding to AV = 1 mag. Dotted line: unreddened main-sequence. Red and dark-red large dots: our data taken before and after June 2017. The green dot represents the colors of 2015 June 22 (AAVSO database). Black data: literature/AAVSO data with the same symbols as in Fig. 1. Right panel: [V ] vs. [V − I]. Symbols and colors as in the middle panel.
Current usage metrics show cumulative count of Article Views (full-text article views including HTML views, PDF and ePub downloads, according to the available data) and Abstracts Views on Vision4Press platform.
Data correspond to usage on the plateform after 2015. The current usage metrics is available 48-96 hours after online publication and is updated daily on week days.
Initial download of the metrics may take a while.