Free Access
Fig. 5
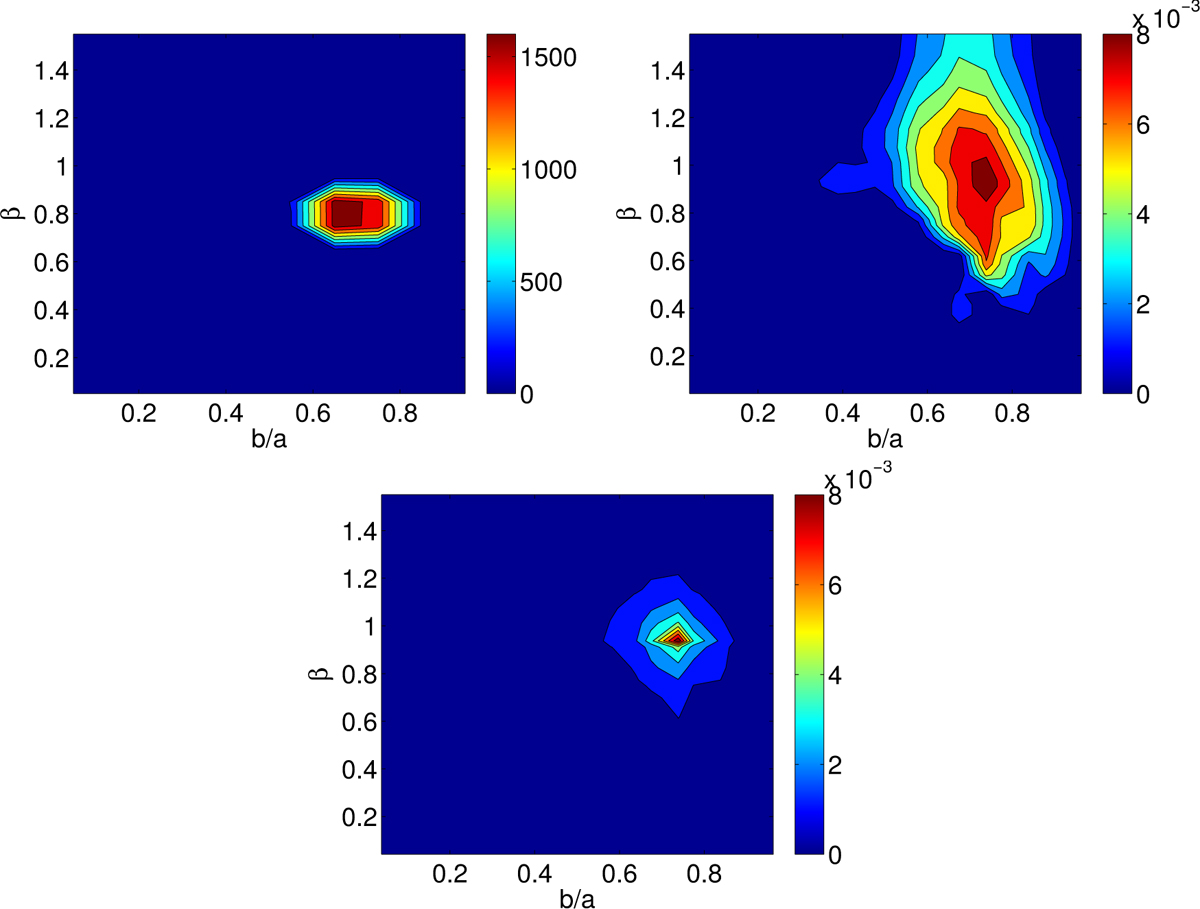
Synthetic simulations using a fixed (b∕a, β) peak for a population of 10 000 asteroids. The top left plot shows the actual (b∕a, β) distribution,the top right shows the computed (b∕a, β) distribution,and the bottom shows the top right solution with a deconvolution filter applied.
Current usage metrics show cumulative count of Article Views (full-text article views including HTML views, PDF and ePub downloads, according to the available data) and Abstracts Views on Vision4Press platform.
Data correspond to usage on the plateform after 2015. The current usage metrics is available 48-96 hours after online publication and is updated daily on week days.
Initial download of the metrics may take a while.