Fig. 7
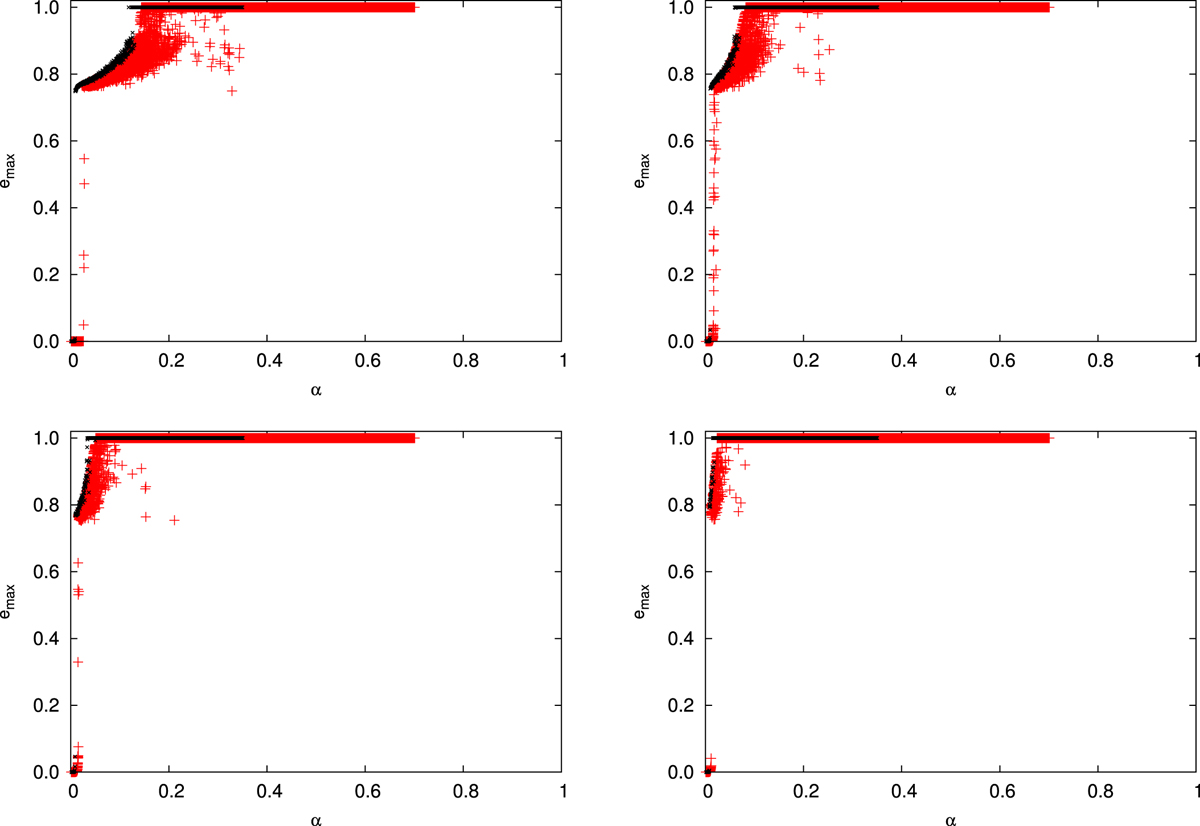
Comparison between the results found for ip = 120°. We compare our two sets of simulations S1 and S2 for μ = 0.2 (red plot) and μ = 0.4 (black plot), respectively. Each panel corresponds to a different value of e2. Top-left, top-right, bottom-left and bottom-right panels correspond to the values of e2 = 0.2, 0.4, 0.6 and 0.8, respectively.
Current usage metrics show cumulative count of Article Views (full-text article views including HTML views, PDF and ePub downloads, according to the available data) and Abstracts Views on Vision4Press platform.
Data correspond to usage on the plateform after 2015. The current usage metrics is available 48-96 hours after online publication and is updated daily on week days.
Initial download of the metrics may take a while.