Fig. 9
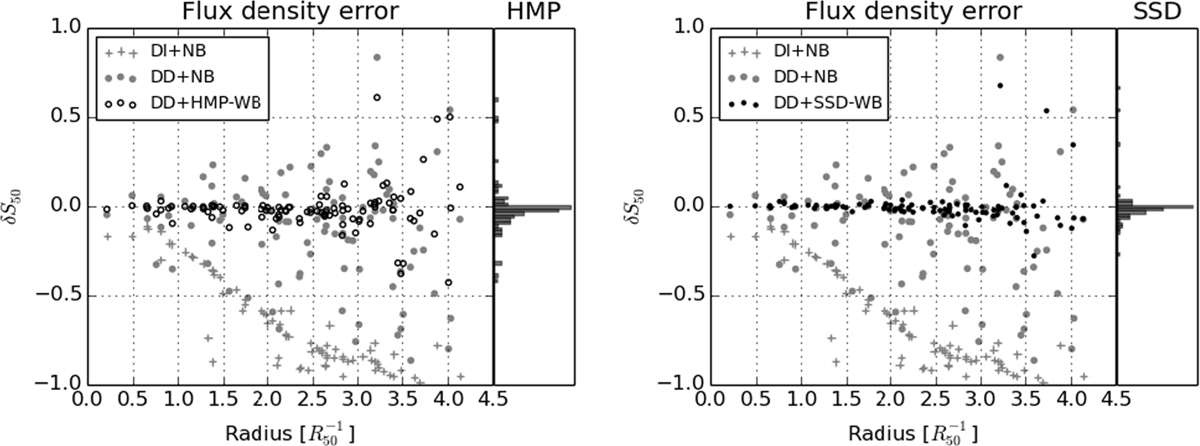
Relative flux density error ![]() between the 50
MHz flux density S50
and its estimate
between the 50
MHz flux density S50
and its estimate ![]() as a function of radius from the beam center (normalized by the half power radius at
50
MHz). The left and right panels show the results for the hmp and ssd wide band deconvolutions (empty and filled
black circles respectively). The gray cross corresponds to the flux densities errors taking neither DDE correction nor
wideband effects into account. The gray dots show the results when taking DDE effects, but not wideband effects into
account.
as a function of radius from the beam center (normalized by the half power radius at
50
MHz). The left and right panels show the results for the hmp and ssd wide band deconvolutions (empty and filled
black circles respectively). The gray cross corresponds to the flux densities errors taking neither DDE correction nor
wideband effects into account. The gray dots show the results when taking DDE effects, but not wideband effects into
account.
Current usage metrics show cumulative count of Article Views (full-text article views including HTML views, PDF and ePub downloads, according to the available data) and Abstracts Views on Vision4Press platform.
Data correspond to usage on the plateform after 2015. The current usage metrics is available 48-96 hours after online publication and is updated daily on week days.
Initial download of the metrics may take a while.