Free Access
Fig. 6
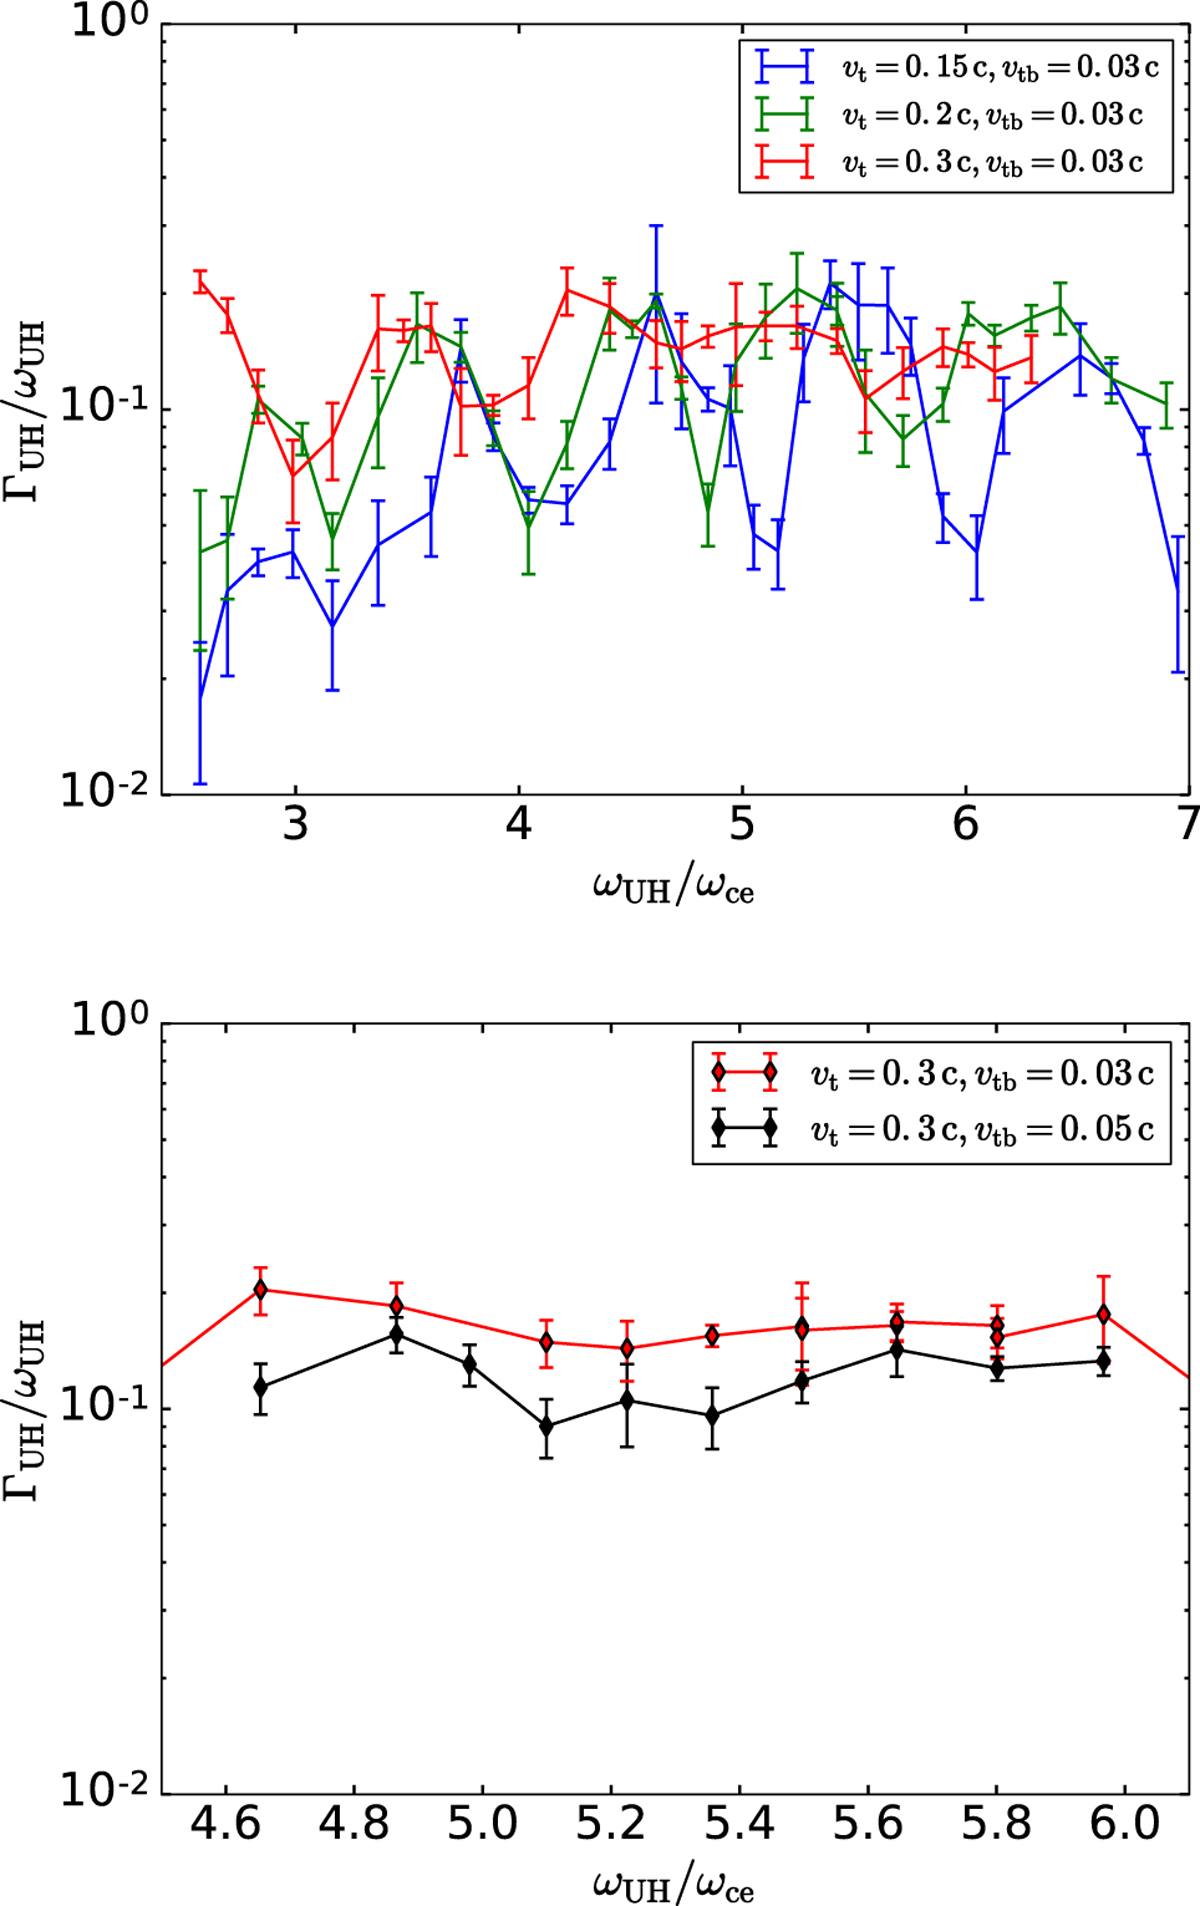
Growth rates in dependence on ωUH ∕ωce for Models 1S–4S. Top: plots for three different temperatures of hot electrons vt . Bottom: plots for two different temperatures of background plasma electrons vtb .
Current usage metrics show cumulative count of Article Views (full-text article views including HTML views, PDF and ePub downloads, according to the available data) and Abstracts Views on Vision4Press platform.
Data correspond to usage on the plateform after 2015. The current usage metrics is available 48-96 hours after online publication and is updated daily on week days.
Initial download of the metrics may take a while.